


Modeling Dye & Durham

Modelers (read: modelooors) have been made a punching bag by many stock picking savants on 𝕏, so this analysis is likely worthless for those gifted with the ability to pick winners simply by looking at three month stock charts. For those of you who evaluate stocks based on cash flow or are interested in modeling, perhaps for use at your job, Dye & Durham (D&D) makes for an interesting case.
On one hand, you have fairly straightforward debt and financial liabilities. On the other hand, its key performance indicators (KPIs) are incredibly opaque, making revenue forecasting a significant challenge.
The model I’m going to detail forecasts cash over eight quarters. This isn’t a full three-statement model and I’m by no means claiming this is the only way you can, or should, go about modeling D&D.
Here is a download link for the model: LINK
The model uses the font Roboto, which isn’t installed by default. You can get it free from Google fonts. If you don’t install the font, the formatting will appear different.
If you intend on reading this article, it’s worth having the model open so that you can poke around as I cover the model’s sections. A brief disclaimer: Nothing in this model should be interpreted as financial advice. No one’s paid me to make this model. DYODD.
I should note, I heavily make use of abbreviations for D&D’s sources of revenue. I incorporate these abbreviations into the model in the C column.
Revenue Decomposition
As mentioned, D&D’s KPI disclosures are limited. Here’s a page from their Q1 FY2025 MD&A which shows the KPIs they do report:

To forecast revenue, the naming convention of D&D’s KPIs that are of use are:
Driven by real estate transactions
Driven by real estate transactions in Canada
These reported KPIs are accompanied by a footnote that clarifies they refer to consolidated revenue that excludes TMG (meaning TM Group) and other non-recurring adjustments. While TMG revenue is clearly disclosed by D&D, instances of non-recurring adjustment don’t always appear to be as readily available. For this reason, my analysis considers the impact of TMG revenue, but not non-recurring revenue adjustments.
Since D&D reports revenue KPIs as percentages, the dollar value of the reported KPI is simply the product of consolidated revenue less TMG revenue and the reported KPI percentage.
For example, Q1 FY2025 revenue driven by real estate transactions (RET) is reported as 48%. Since Q1 FY2025 consolidated revenue is $119.9 million and TMG revenue is $0, the dollar value of RET revenue is $57.6 million ($119.9 × 48%). Similarly, the dollar value of revenue driven by real estate transactions in Canada (CA-RET) is $30 million ($119.9 million × 25%).
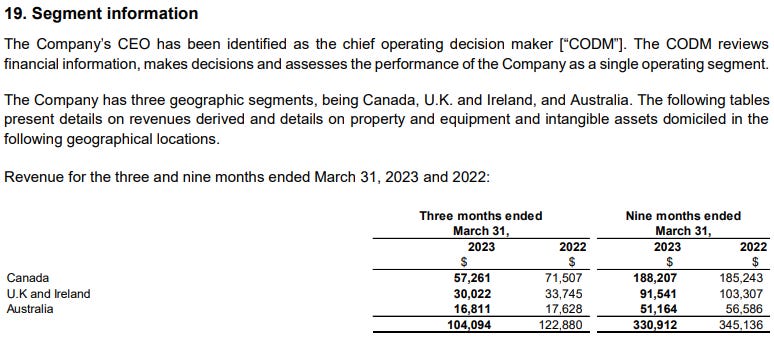
In reporting RET revenue and CA-RET revenue, D&D also indirectly allows for revenue driven by real estate transactions internationally (IN-RET) to be calculated. IN-RET revenue is simply RET revenue minus CA-RET revenue. For Q1 FY2025, IN-RET revenue is $27.6 million ($119.9 million × (48% – 25%)). It’s also implied that revenue not driven by real estate transactions (NON) is equal to total revenue minus RET revenue, or $62.4 million ($119.9 million × (100% – 48%)).
Furthermore, because D&D breaks revenue out by geography, the reported KPIs can be used to determine RET and NON revenue by geography. For Q1 FY2025, Canadian revenue is $69.8 million. Because Canadian revenue must equal CA-RET revenue plus revenue not driven by real estate transactions in Canada (CA-NON), CA-NON revenue can be determined to be $39.8 million ($69.8 million – $30 million).
Here are the values calculated thus far (in thousands of units):

D&D’s geographic revenue breakdown includes four regions:
Canada
UK & Ireland
Australia
Other
Because D&D’s reported KPIs only provide country-specific disclosure for Canada (i.e., D&D only discloses RET revenue for Canada), IN-RET and revenue not driven by real estate transactions internationally (IN-NON) can’t be attributed to specific geographies.
However, D&D’s Other geography refers to South Africa. Specifically, Other pertains to D&D’s acquisition of GhostPractice in May 2023. This is why the Other revenue line appears beginning in D&D’s June 2023 ended Q4 FY2023 financials.
D&D’s Q3 FY2023 financials don’t contain a line for Other:
D&D’s Q4 FY2023 do contain a line for Other:

In its acquisition press release, D&D describes GhostPractice as follows:
Headquartered in Cape Town, South Africa, GhostPractice is a leading provider of legal practice management software to about 10,000 users working primarily in small- and medium-sized law firms. With about 110 employees, GhostPractice is the largest provider of legal practice management software in South Africa and also serves law firms in Canada. Financial terms were not disclosed.
“Today’s transaction strongly complements our existing product suite, expands our global practice management capabilities and footprint and will also accelerate our strategy to increase recurring contractual revenue,” said Dye & Durham CEO Matthew Proud. “We are building Dye & Durham into the world’s legal technology leader. The acquisition of GhostPractice marks yet another concrete step on this journey, while diversifying our business into a new geography.”
As legal practice management software that’s contractual, it can be assumed that GhostPractice falls under NON revenue, not RET revenue. Working with this assumption, it can be deduced that IN-RET revenue encompasses revenue from UK & Ireland and Australia, but not South Africa.
Because D&D reports revenue from South Africa in its financials, IN-NON can be separated into two distinct values:
UK & Ireland and Australian revenue (which I’ll still abbreviate as IN-NON)
South African revenue (SA-NON)
Here’s the amended Excel worksheet which incorporates these changes:

Recall from above that for Q1 FY2025 NON revenue and CA-NON revenue were determined to be $62.4 million and $39.8 million. D&D’s segment reporting indicates SA-NON revenue to be $0.8 million, meaning IN-NON revenue must be be NON revenue minus CA-NON revenue minus SA-NON revenue, or $21.7 million ($62.4 million – $39.8 million – $0.8 million).
Here is the completed Excel worksheet for Q1 FY2025:

D&D discloses RET revenue and CA-RET revenue KPIs dating back to Q2 FY2021. Performing the same revenue decomposition exercise outlined above, making sure to factor in TMG revenue when appropriate, produces the following table:
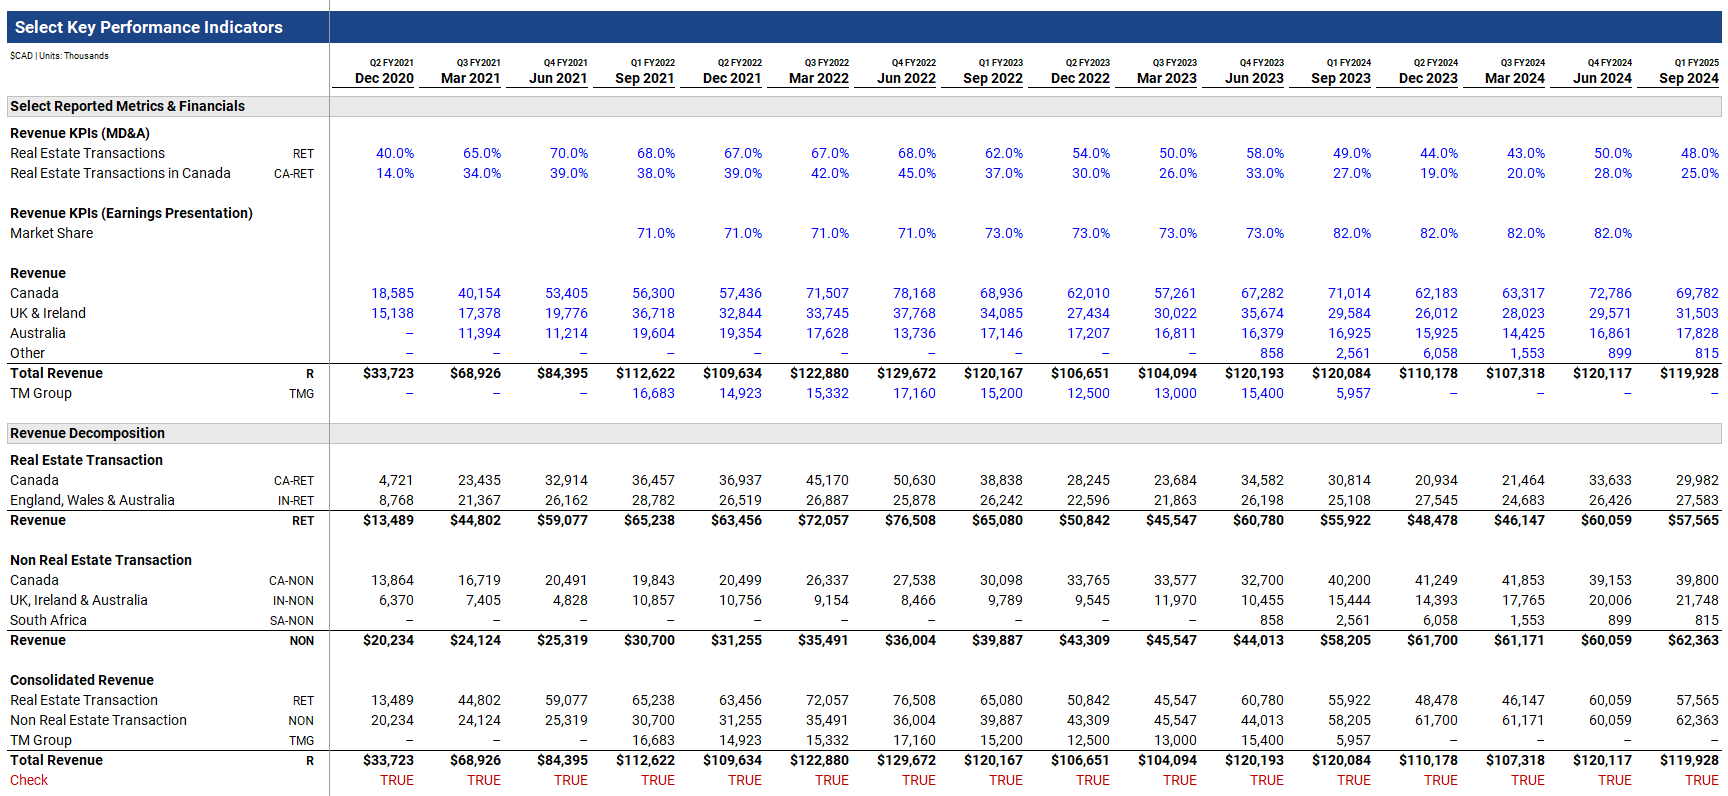
This table is available on the KPI worksheet within the model. Note that TMG revenue is estimated based on disclosures in MD&A.
Whereas the KPI worksheet contains quarters beginning with Q2 FY2021 onward, the model itself (available on the Model worksheet) only includes historical quarters beginning with Q2 FY2023.
Real Estate Transaction Revenue Build
D&D’s Q2 FY2023 earnings presentation has a slide that shows what it describes as its illustrative revenue potential in Canada:
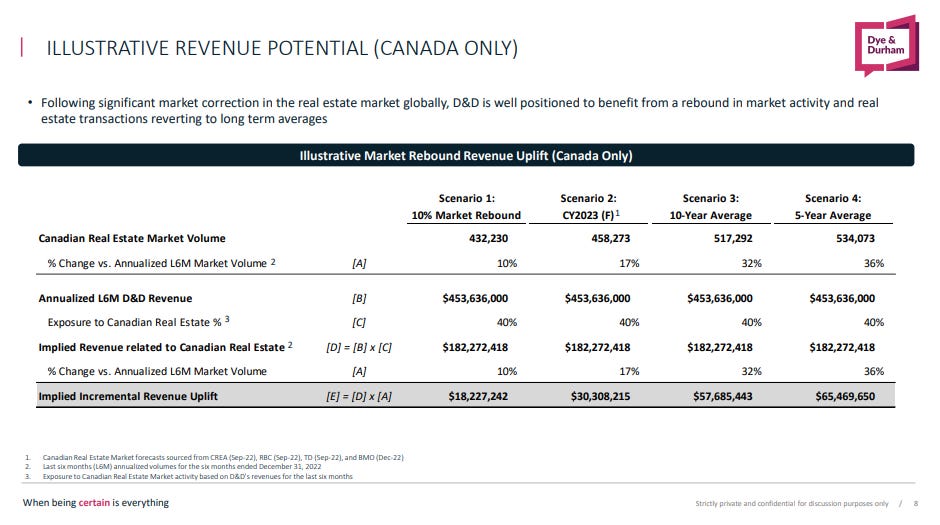
This slide indicates that, as at Q2 FY2023, 40% of D&D’s consolidated revenue was exposed to Canadian real estate for the last six months (as at Q2 FY2023). D&D’s reported CA-RET revenue KPIs for Q1 and Q2 FY2023 are 37% and 30%, respectively. The difference suggests CA-NON revenue has exposure to Canadian real estate, but, for whatever reason, isn’t captured in CA-RET revenue. Regardless, this slide suggests that a way to forecast CAN-RET revenue is as a linear relationship between Canadian real estate volumes and D&D ‘s revenue expose to Canadian real estate.
Here is a breakdown of the aforementioned slide that I’ve shared in my previous article, Reflecting on Dye & Durham’s Q4 FY2024 Results:

I expand on D&D’s slide by backing into an implied revenue per transaction figure (letter H). The important takeaway from this is that CA-RET revenue (letter G) is the product of Canadian real estate volumes (letter A) and a revenue per transaction figure (letter H).
Revenue calculated in this manner is imperfect for two key reasons:
It doesn’t factor in D&D’s market share since revenue is built off national Canadian housing volumes.
It doesn’t incorporate the sides to a real estate transaction — buys, sells, and mortgage-only/refinancing transactions.
OneMove Technologies (OneMove), the company that would ultimately become D&D, used to disclose their sides to a real estate transaction in their MD&A. However, D&D no longer does:

In the model, I’ve estimated the number of sides of a real estate transaction at 2.6. While there are always at least two sides to a real estate transaction (one buyer and one seller), sometimes there isn’t debt involved, which is why the sides figure is a fraction that’s less than three.
To establish D&D’s market share in Canadian real estate transactions, I refer to their Q1 FY2025 earnings presentation:

Taking market share and the sides to a real estate transaction into consideration allows for a more complete build of CA-RET revenue. This updated build of CA-RET revenue is equal to housing sales multiplied by sides multiplied by D&D’s market share multiplied by D&D’s revenue per transaction:

Assuming D&D’s market share stayed constant at 82% from FY2024 into Q1 FY2025, the following variables are known:

Housing sales multiplied by sides determines housing transactions. Housing transactions multiplied by D&D’s market share determines the transactions performed (by D&D). Because CA-RET revenue is disclosed through D&D’s KPIs, revenue per transaction is able to be backed into. Forecasting housing sales, D&D’s market share, and revenue per transaction serves as the basis for forecasting CA-RET revenue in the model. I will cover this in more detail later in the article.
For IN-RET revenue, recall that it pertains to UK & Ireland and Australia, but not South Africa. D&D, when referring to UK & Ireland housing sales in earnings presentations, footnotes that only England & Wales housing sales are shown as they’re the most relevant regions to D&D in the United Kingdom and Ireland. Q2 FY2023’s earnings presentation shows this:

To forecast IN-RET revenue, I perform a revenue build similar to the one outlined in D&D’s Q2 FY2023 earnings presentation. In other words, I don’t consider D&D’s market share or the sides to a transaction. Why not? For no other reasons than the fact that D&D doesn’t disclose its market share, nor do I deem it worthwhile to add a fixed variable (sides; 2.6) when building to revenue — it would be a redundant complexity. This means that revenue is equal to housing sales from England & Wales and Australia multiplied by revenue per transaction:
For Q1 FY2025, the following variables are known:

I detail how to scrape housing data for D&D’s relevant geographies using python so that the missing information can be filled in.
Housing Data
In an unpublished piece called Dye & Durham Roll Call (which you can read here), I share a table of the publicly available data sources I incorporate into my model. I note the following:
I should note, the Canadian real estate transaction data from CREA is national and seasonally adjusted. Province-level data that’s not seasonally adjusted is available from sister sites — for example, AREA has Alberta-level data. I’ve fortunately been able to obtain a historical database of seasonally unadjusted provincial-level data.
The code I’m sharing here won’t scrape proprietary data — specifically, the Canadian non-seasonally adjusted data. This is why the export contains blank columns. However, I include this data in the model. You don’t need to run any of the following code, I’m simply sharing it for demonstration purposes.
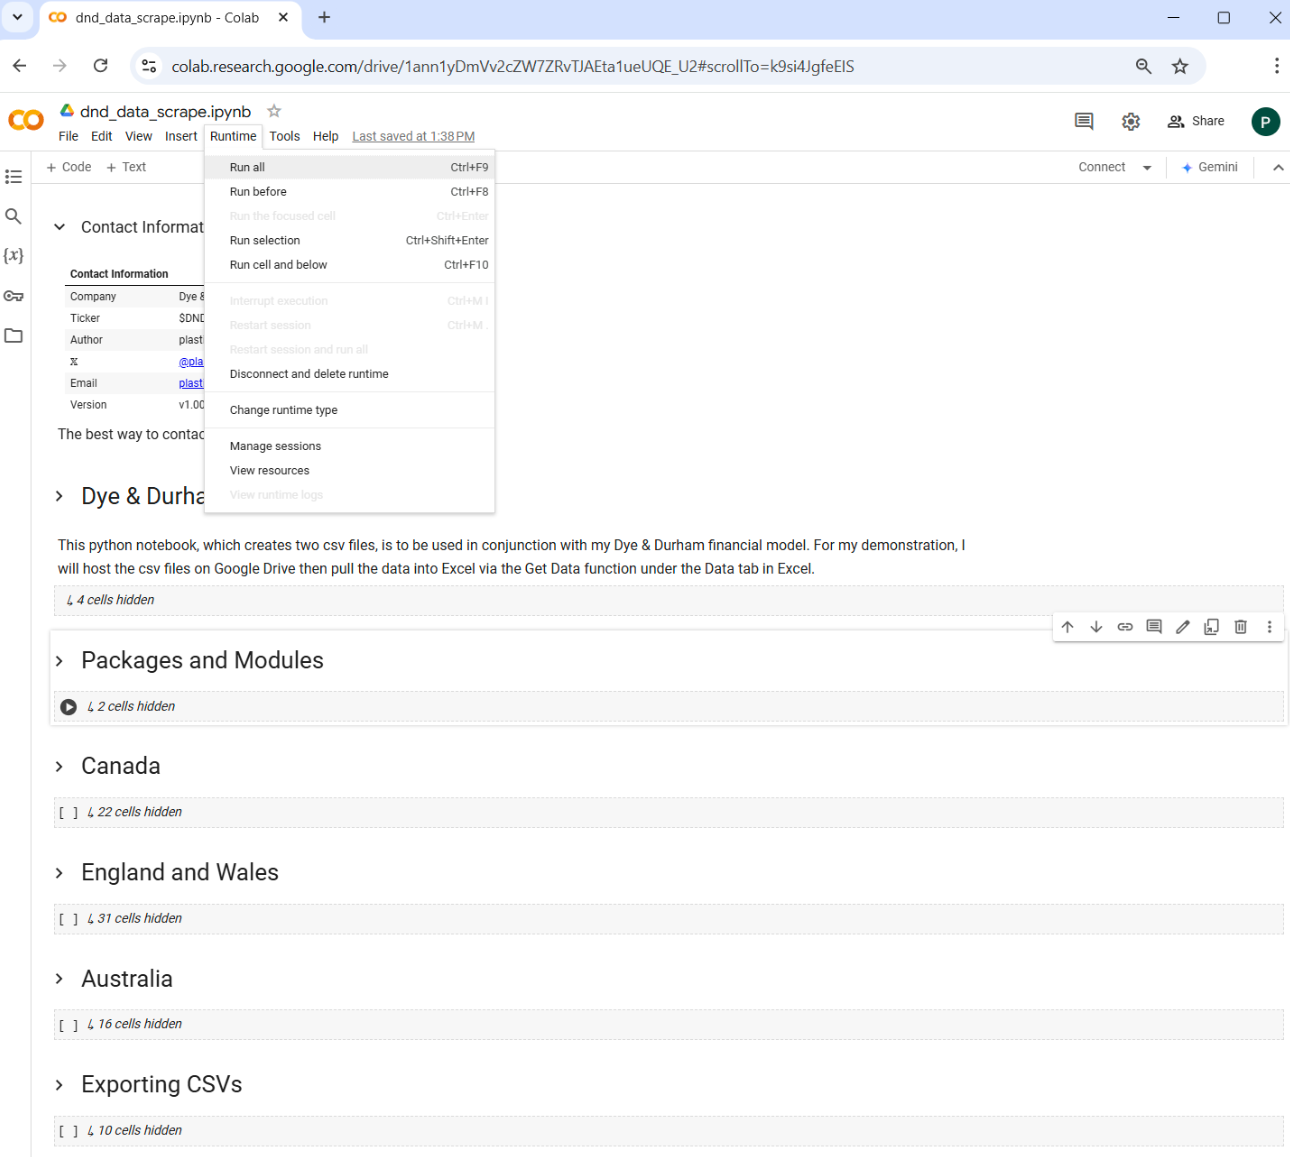
To gather and clean the public data, I’ve created a Juypter notebook on Google Colab (Colab) that’s available here.
The code creates two .csv files which are output to Google Drive at the following directory:
/content/drive/MyDrive/Stocks/DND/If you run the Colab notebook and you don’t have this directory, the code won’t work. You must first create the directory. To create the directory, go to Google Drive, then click My Drive (under Home). On My Drive, create a new folder called Stocks. Within the Stocks folder, create a new folder called DND.
If you go to the Colab notebook and run it, it will prompt you for the ability to write to your Google Drive. This is simply the code outputting the .csv files to your drive. As well, it should overwrite the .csv files as new data becomes available. Feel free to go through the code line-by-line:
I use BeautifulSoup and a Selenium to scrape some data — because the format of the webpages I scrape data from are unlikely to remain static, the code is likely to not work in the future. I have no intention of updating the code — you’re on your own at that point, bucko.
If the code runs successfully, you should have two files in the directory I mentioned:
dnd_monthly_data.csv
dnd_quarterly_data.csv
The file that will be used in this model is dnd_quarterly_data.csv. If you open dnd_quarterly_data.csv in Excel, it should look something like this:

Again, can_trn and can_trn_kg are blank because the data comes from a proprietary source.
This data is formatted and available within the model on the Data worksheet.
Model Overview
The model forecasts eight quarters forward and provides eight historical quarters to inform inputs. It has four worksheets:
Cover: General overview of the model.
Model: Core model; detailed later in this article.
KPI: Select financial and KPI data reported by D&D; includes historical revenue decomposition and CA-RET revenue builds using three housing sales data series.
Data: Scraped housing data; primarily from the Colab notebook export.

The model uses the font Roboto, which isn’t installed by default:

It’s freely available from Google Fonts. You install it as you do any other font. Why am I using a non-default font? Because it looks beautiful.
The model somewhat adheres to the typical financial model colour formatting:
Blue font: Inputs
Black font: Outputs/formulas
Green font: References to other worksheets
Brown font & brown background: Dropdown lists
Red dots background: Cells that aren’t needed (effectively greyed out)
The primary formatting exception: I’ve hardcoded figures that linked to D&D’s fiscal year and fiscal quarter financials and deleted these worksheets — these values will appear purple:
The Model worksheet contains 10 sections:
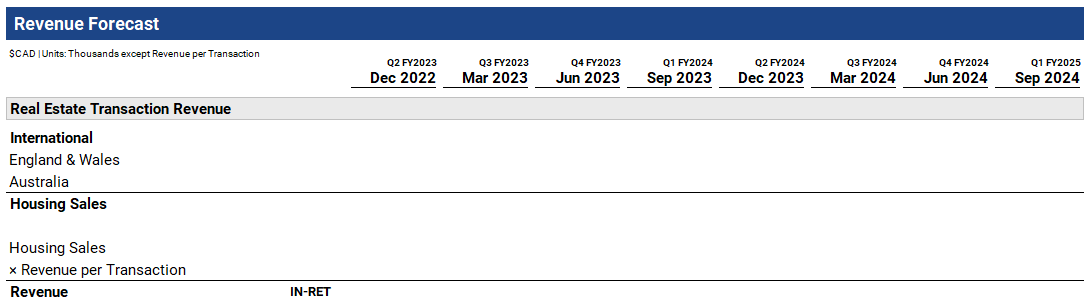
Revenue Forecast: Forecast that employs the real estate revenue build, as well as the revenue decomposition.
CFADS Forecast: Bridging to CFADS from revenue on a cash basis.
Debt Schedule Overview: High-level overview of the debt waterfall, covering interest, as well as mandatory and optional debt repayment.
Debt Securities: Debt security-level breakdown of the debt waterfall.
Cash Flow Statement: Simple, abbreviated output of the model’s produced cash flow statement.
Valuation: Simple valuation on an enterprise value metric.
Comparable Companies: Data taken from an image; FactSet is the source.
Summary Statistics: Various financial and housing figures and metrics; often presented on a trailing and forward basis.
Checks: Comparing the model’s calculated financial metrics to D&D’s IFRS reported financial metrics; complete reconciliation of beginning to ending cash.
Lists & Lookups: Collection of dropdown lists used within the model.
Each section is indicated by a dark blue row with white text, with the section’s working currency and units shown immediately below it:

Most sections are portioned to aid in readability. The portions are indicated by a grey row with black text:

So that it’s easier to follow along, when I refer to a section within this article, I will bolden its name; for portions, I will bolden and italicize its name. Using the picture immediately above this paragraph as an example, Revenue Forecast would refer to the section and Real Estate Transaction Revenue would refer to the portion within Revenue Forecast.
As I walk through the model, it’s important to remember that I don’t have have a crystal ball — the model’s forecast is almost certainly going to depart from how D&D’s results evolve. To the extent that I make an assumption, I try my best to explain the reasoning behind it. I encourage you to amend my assumptions as you see fit.
Model Section 1. Revenue Forecast

Revenue Forecast contains four portions:
Real Estate Transaction Revenue
Non Real Estate Transaction Revenue
Divested Revenue
Housing Stock for Housing Yield
1.1 Real Estate Transaction Revenue

Real Estate Transaction Revenue utilizes the revenue build previously detailed. It consists of the following parts:
Canadian real estate transaction revenue (CA-RET revenue)
International real estate transaction revenue (IN-RET revenue)
1.1.1 Canadian Real Estate Transaction Revenue

The brown-shaded cell in the upper left allows you to select housing sales data from one of three data series:
Unadjusted housing sales
Seasonally adjusted housing sales
Housing sales from key geographies (unadjusted data)
The current selection (housing sales from key geographies) is based on seasonally unadjusted housing sales from the provinces most important to D&D:
Ontario
British Columbia
Alberta
CA-RET revenue is calculated as housing sales multiplied by sides per transaction multiplied by D&D’s market share multiplied by revenue per transaction. For Q2 FY2025, I calculate CA-RET revenue as $28.3 million:
# Units: Thousands

Housing Sales                          78      #Input Through Y/Y Growth
× Sides Per Transaction                 2.6    #Input
= Housing Transactions                202

Housing Transactions                  202
× D&D Market Share                      0.80   #Input
= Transactions Performed              161

Transactions Performed                161
× Revenue Per Transaction             176      #Input
= CA-RET Revenue                   28,332
Beneath housing transactions is housing yield:
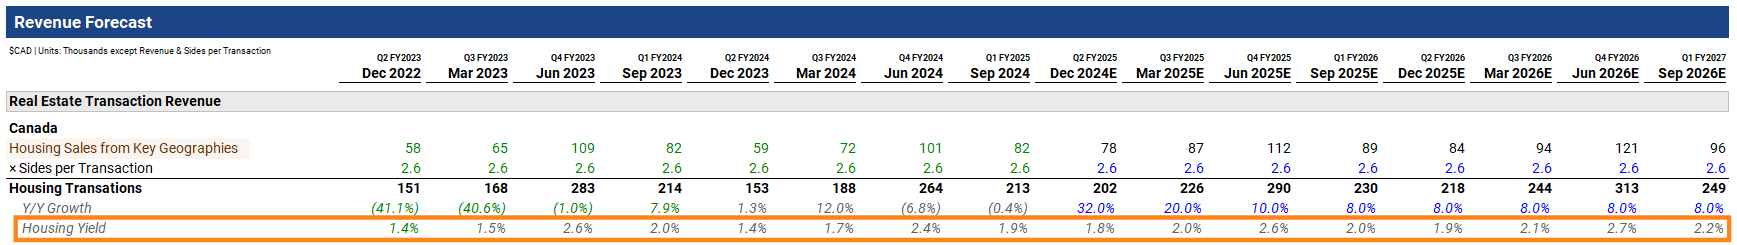
The housing yield figure annualizes housing sales and compares it to the average amount of housing stock over the period — it’s essentially no different than a turnover figure. Housing yield doesn’t factor into the revenue build and is used to sanity check forecasted housing sales.
To calculate CA-RET revenue, the key drivers are as follows:
Housing sales growth
D&D’s market share
Revenue per transaction
Housing sales growth determines the amount of housing sales. Speaking to my assumed growth figures, Canada is just beginning to come out of a post-COVID trough. Housing sales in D&D’s key geographies have been announced for October and November and are in the 30% to 40% range. I assume 32% growth in key geography housing sales for Q2 FY2025, with that figure tapering off to 8% as of Q1 FY2026. I hold this growth estimate at 8% into the model’s final quarter.
For market share, in light of Tegus expert interview detailing increased competition and contracts resetting in early calendar 2025, I assume D&D’s market share declines from 80% currently to 65% in Q3 FY2025, then continues to decline at 1% a quarter. This places my estimate of D&D’s market share at 59% in the model’s final quarter.
It should be noted that this market share estimate is on a transaction-basis, so not dollar share.
For my estimate of revenue per transaction, I assume it stays constant at the Q1 FY2025 amount of $176.
Given CA-RET revenue makes up approximately 25% of D&D’s total revenue, it goes without saying that the inputs used for any of these assumptions have a material impact on valuation.
1.1.2 International Real Estate Transaction Revenue

IN-RET revenue is calculated as the total of England & Wales and Australian housing sales multiplied by revenue per transaction. For Q2 FY2025, I have IN-RET revenue at $28.5 million:
# Units: Thousands

England & Wales Housing Sales         257      #Input Through Y/Y Growth
+ Australia Housing Sales             133      #Input Through Y/Y Growth
= Housing Sales                       390

Housing Sales                         390
× Revenue Per Transaction              73      #Input
= IN-RET Revenue                   28,467
Whereas the post-COVID period saw England & Wales housing sales decline, Australian housing sales stayed elevated. England & Wales housing sales have just begun to rebound, so I assume elevated short-term growth that eventually tapers off to 3%, at which point the 3% growth estimate is held constant. For Australia, I assume a decline in housing sales each quarter over the next twelve months, then hold growth flat.
For revenue per transaction, I take an average of the previous four quarters, arriving at $73. I assume this figure stays constant over the forecast period.
1.2 Non Real Estate Transaction Revenue
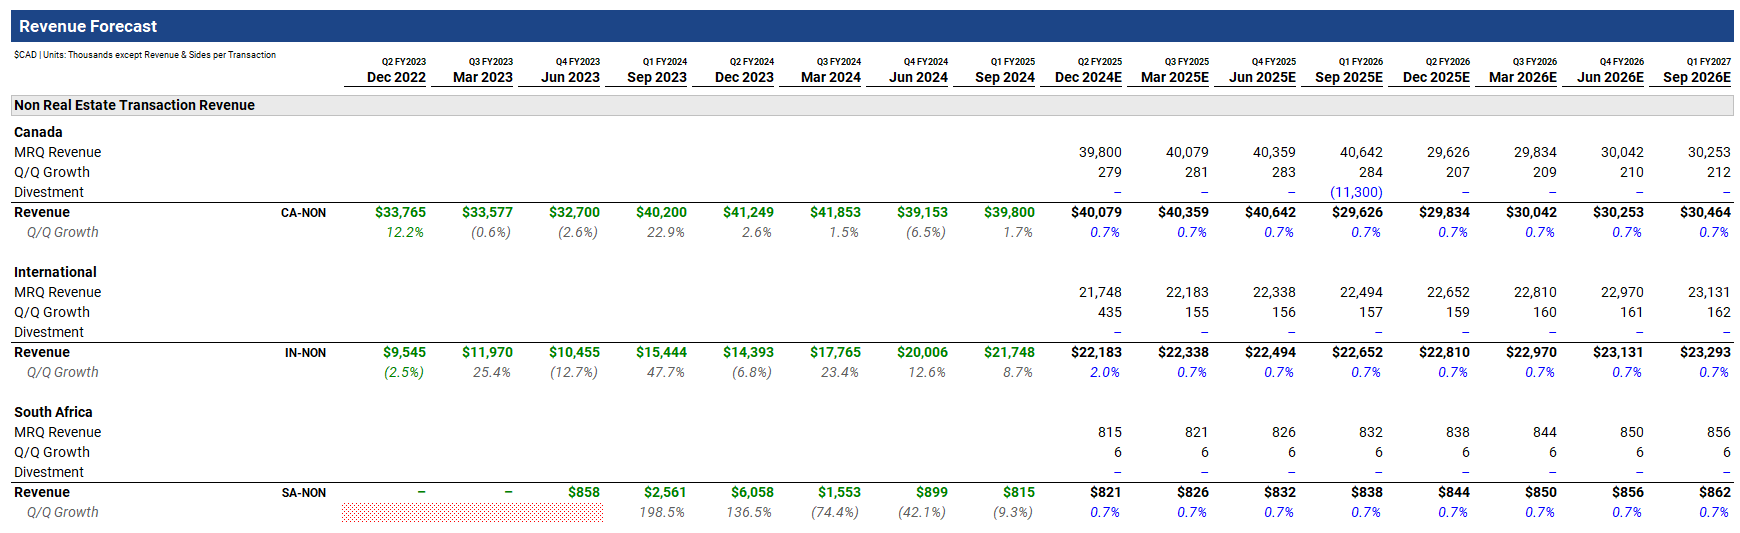
The Revenue Forecast section continues with Non Real Estate Transaction Revenue, adhering to the revenue decomposition previously mentioned.
As far as I can tell, there’s seemingly no data that can be used to reliably drive NON revenue. Consequently, I structure the revenue build as the most recent quarter’s revenue plus an amount of sequential growth over the quarter, less any divested revenue. This revenue build structure is used for all three parts of NON revenue: CA-NON, IN-NON, and SA-NON.
For Q2 FY2025, I arrive at $63.1 million of NON revenue:
# Units: Thousands

CA-NON MRQ Revenue                 39,800
+/− Q/Q Growth                        279     #Input Through Q/Q Growth
− Divestment                            0     #Input
= CA-NON Revenue                   40,079

IN-NON MRQ Revenue                 21,748
+/− Q/Q Growth                        435     #Input Through Q/Q Growth
− Divestment                            0     #Input
= IN-NON Revenue                   22,183

SA-NON MRQ Revenue                    815
+/− Q/Q Growth                          6     #Input Through Q/Q Growth
− Divestment                            0     #Input
= SA-NON Revenue                      821

CA-NON Revenue                     40,079
+ IN-NON Revenue                   22,183
+ SA-NON Revenue                      821
= NON Revenue                      63,082
To determine revenue, the key inputs are as follows:
Sequential revenue growth
Divestment
Other than assuming some continued spillover revenue growth from D&D’s APAC acquisitions, which pad Q2 FY2025’s IN-NON revenue, I assume sequential revenue growth approximates GDP growth — roughly 0.7% growth per quarter, sequentially.
Divestment refers to business dispositions and, as such, it’s value must be negative or set at 0.
I’m assuming divestment of Canadian non-real estate transaction revenue of $11.3 million in Q1 FY2026. What follows is details my reasoning behind this assumption.
On December 6, 2021, D&D acquired Telus Financial Solutions Business (TFSB) from Telus Corporation for $500 million. TFSB consisted of two primary assets, Assyst Payment and Assyst Real Estate:

On a Status Update call conducted shortly after the acquisition, D&D CEO Matthew Proud (Matt) detailed TFSB and fielded questions from sell-side analysts. Picking up mid-way through the call, Matt describes Assyst Real Estate and Assyst Payment:
So on the real estate or lending side, it is a price per transaction that is paid by the law firms or invested notaries. And on the payments side, it’s a fee that the banks are paying. So when you back up and think about it, on the lending/real estate side, the banks are your suppliers and the law firms are the customers. And on the payments side, the banks are your customers.
Stephen Boland at Raymond James asks a question in response to Matt’s answer:
Just have you disclosed the split between the two businesses in terms of revenue? I’m not sure if you have done that yet. Or can you give us a range?
Matt replies to Stephen:
The split between the two businesses is about 50-50, so real estate business and the payment business is about half-half today.
The latest time at which disclosure is given for TFSB’s total contribution to D&D revenue comes from Q1 FY2023’s MD&A, where it’s cited as less than 13% of total revenue:

Since D&D’s Q1 FY2023 revenue was $120.2 million, this would place TFSB’s revenue at roughly $15 million ($120.2 million × 12.5%) for the quarter. Taking the previously mentioned split between Assyst Payment and Assyst Real Estate into consideration, this would place Telus Assyst Payment’s revenue at half of the $15 million, equal to $7.5 million.
To approximate Telus Assyst Payment’s revenue growth over the intervening quarters, I refer to comments made by the CEO of D&D’s Financial Services business, Yves Denomme, on the Q1 FY2025 earnings call:
Today, Financial Solutions, as Matt mentined, represents a little over 20% of Dye & Durham globally. What we do in a few word, we empower financial service providers through integrated technology solutions that connect them, the critical partners supporting the bill in tax payment and home buying journey. We also provide leading credit unions and alternative lenders with managed banking services. The consistent, reliable business with a strong value proposition and with virtually all revenue secured under long-term contracts. We’re pleased with our performance in the first quarter of fiscal 2025, and we’re seeing year-over-year revenue growth of more than 20%.
I assume Telus Assyst Payment is divested in Q1 FY2026, which means there’s three years of organic growth which needs to be added to the previously mentioned $7.5 million in quarterly revenue. I estimate revenue grew at 20% for the first two years, based largely on Yves’ commentary, then assume growth tapers off to 5% over the final year. This would place Telus Assyst Payment at approximately $11.3 million of quarterly revenue at the time of divestment ($7.5 million × 1.2 × 1.2 × 1.05). I input this figure into the model as a negative amount in Q1 FY2026.
1.3 Divested Revenue

Divested Revenue from the Revenue Forecast section flows down and is annualized. Continuing with the discussion of the divestment of Telus Assyst Payment in Q1 FY2026, I annualize its quarterly revenue to aid in calculating a sales proceeds figure, arriving at an estimate of $45.2 million of annual revenue ($11.3 million × 4). I also calculate an estimate of annual adjusted EBITDA, based on an estimate of the adjusted EBITDA margin for the segment. I cover segment adjusted EBITDA margin estimates later.
The amount of proceeds is built off a sale multiple, multiplied by either annual revenue or adjusted EBITDA. You can toggle between the two options using the dropdown list in the brown-shaded cell. For the divestment of Telus Assyst Payment, I apply a 10x multiple to my estimate of annual adjusted EBITDA and arrive at sales proceeds of $298.3 million.
Any estimated sales proceeds from Divested Revenue flows down to the Debt Schedule Overview section, where it is used to service and/or paydown debt. Divested revenue is limited to NON revenue segments.
1.4 Housing Yield

Housing Stock for Housing Yield is where housing stock is estimated. Housing stock is the denominator in housing yield. Again, housing stock doesn’t factor into the revenue build. Rather, it serves as a simple way to sanity check any estimates of housing sales forecasts.
Additional historical housing sales data is available on the Data worksheet. If you want even more historical data, you can amend my Colab code. The housing stock and housing sales data series go back many years more than the data contained within the model.
Model Section 2. CFADS Forecast

CFADS Forecast bridges from revenue to cash flow available for debt service (CFADS). There are three portions to this section:
Cash Flow Available for Debt Service
Common Size Analysis
Drivers
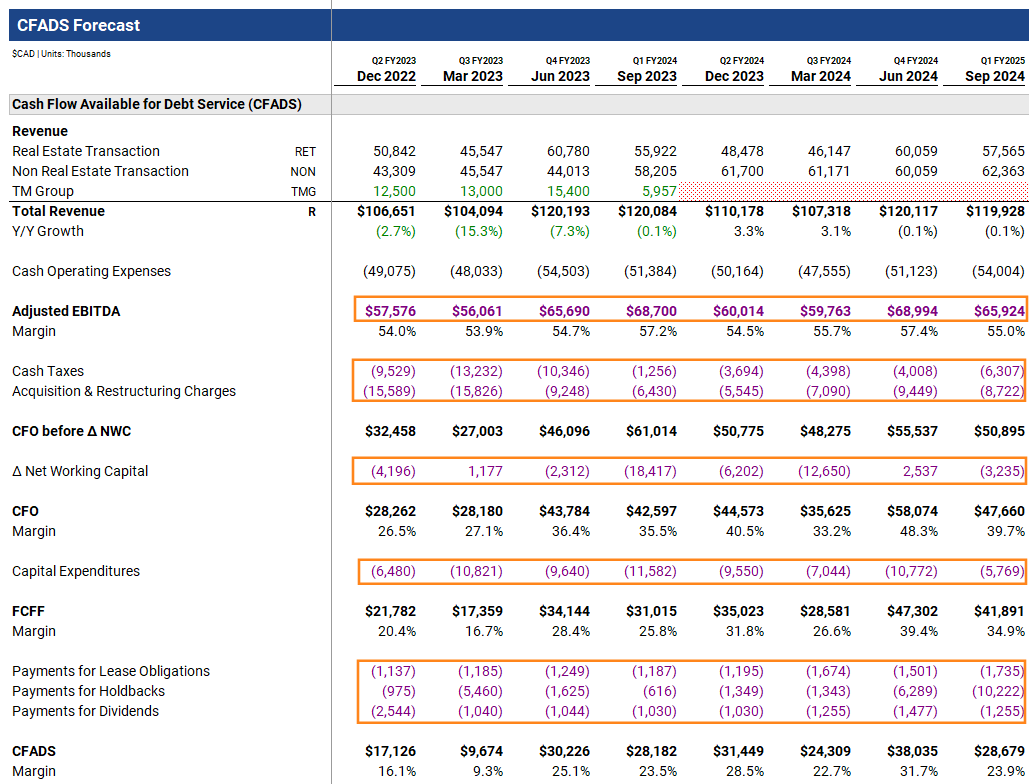
2.1 Cash Flow Available for Debt Service

There are a number of different ways you can calculate CFADS, depending on what the figure you’re calculating is trying to represent. I’m calculating CFADS aftering paying leases, holdbacks, and dividends — essentially an operating cash flow figure before servicing debt obligations (the new credit facility and convertibles), but after servicing debt-like obligations (leases and holdbacks). This primarily has to do with the mechanics of the debt schedule. Said differently, the calculated CFADS figure doesn’t respect the actual seniority within D&D’s capital structure.
What it does do, in effect, and when combined with non-operating cash flow (e.g., proceeds from divestitures), is provide an amount of cash D&D has to meet interest payments, mandatory principal payments, and optional principal payments.
The primary insight from Cash Flow Available for Debt Service is that the cash bridge from revenue to CFADS is only a few key line items. I calculate Q2 FY2025 CFADS as $24.7 million:
# Units: Thousands

Revenue                           119,881
− Cash Operating Expenses         (52,937)     #Input Through EBITDA Margin
− Cash Taxes                       (6,596)     #Input
− Acquisition & Restructuring      (8,000)     #Input
+/− Change in Net Working Capital  (1,000)     #Input
− Capital Expenditures             (6,000)     #Input
− Payments for Lease Obligations   (1,750)     #Input
− Payments for Holdbacks          (17,618)
− Payments for Dividends           (1,256)
= CFADS                            24,725

CFADS                              24,725
÷ Revenue                         119,881
= CFADS Margin                          0.2062
With revenue calculated from Revenue Forecast, the remaining inputs to calculate CFADS from this section are as follows:
Adjusted EBITDA margin
Cash taxes
Acquisition & restructuring charges
Change in net working capital
Capital expenditures
Payments for lease obligations
These inputs are set in Drivers of this section.
Payments for holdbacks is set in the Debt Schedule & Interest Rate Curves portion of Debt Schedule Overview.
Payments for dividends is assumed to equal $1.3 million a quarter ($0.01875 quarterly dividend per share × 66.9 million shares).
2.2 Common Size Analysis

Common Size Analysis is meant to viewed in conjunction with Drivers to aid in expense forecasting. Everything is stated as a percentage of quarterly revenue. It should be noted that expenses are set a positive percentage of revenue for visual purposes. This is despite their values being negative in Cash Flow Available for Debt Service. Further, because the change in net working capital can also be a source of cash, its value sometimes appears negative. Because it’s treated as an expense with respect to formula formatting (i.e., negative values are made positive), a negative value for net change in working capital means that it was a source of cash for the quarter — for example, in Q4 FY2024.
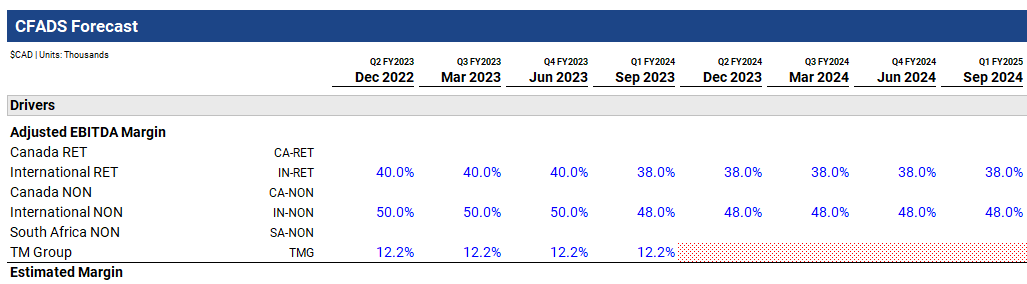
2.3 Drivers
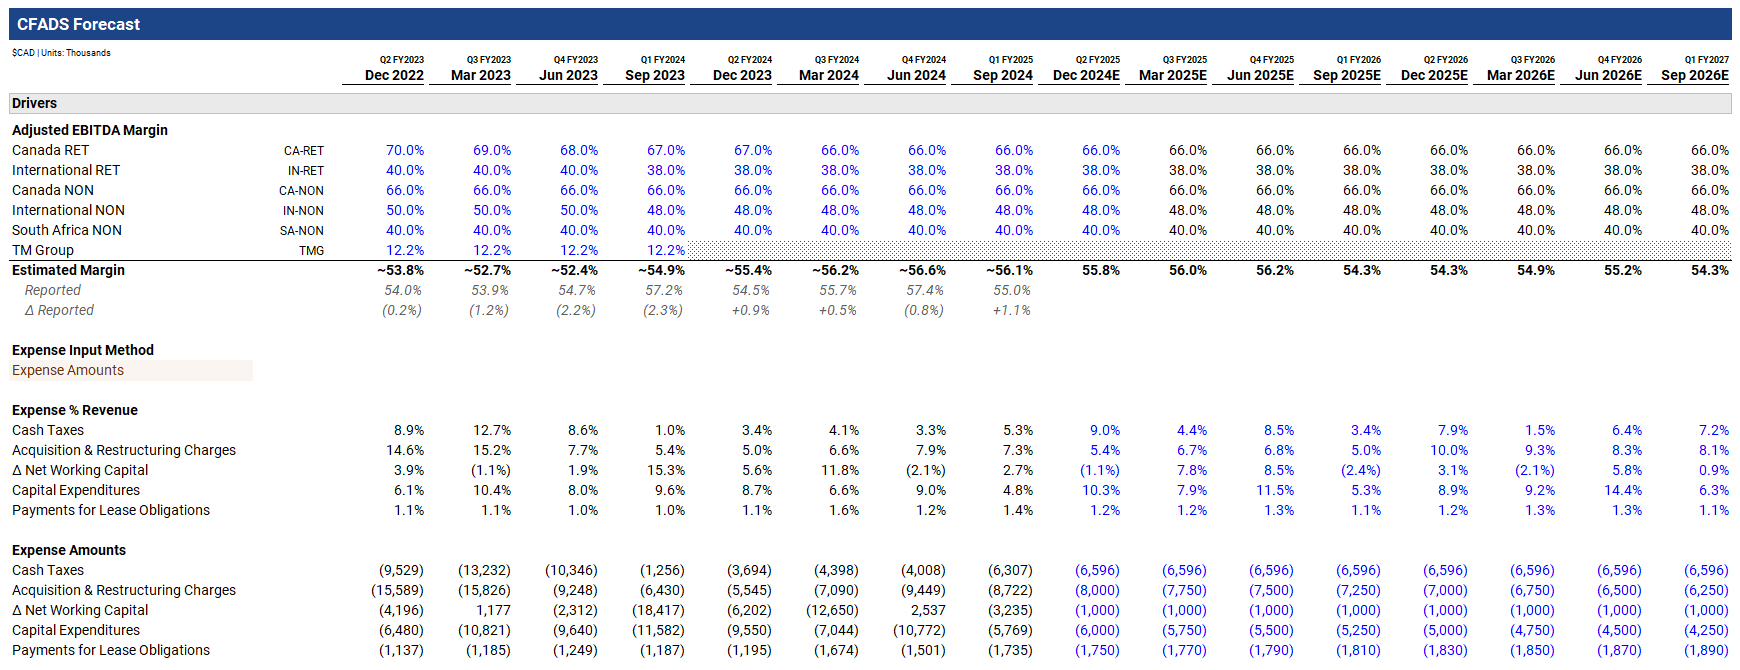
The explanation behind the variables for the estimated EBITDA margin by segment (e.g., CA-RET, CA-NON, IN-NON, etc.) is long and drawn out, so I’ll speak to the expense forecasting part of Drivers first.
2.3.1 Expense Forecasting

Expenses can either be forecast using a percentage of revenue or absolute amounts. The brown-shaded cell provides a dropdown to allow you for your preferred method of forecasting expenses. Again, note that when using the percentage of revenue method, the percentage is flipped.
Historically, acquisition & restructuring charges and capital expenditures have been large line items for D&D, which is why free cash flow conversion (what I define as FCFF/adjusted EBITDA) is poor. I show this in Summary Statistics:
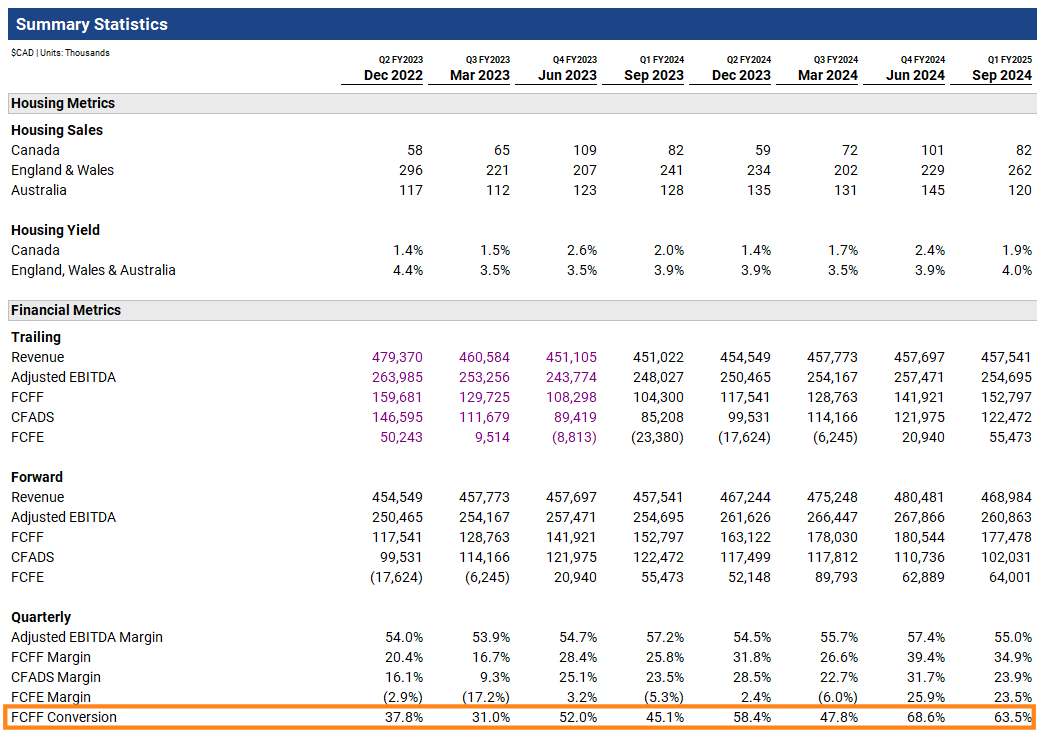
Over D&D’s entire history, I have average quarterly free cash flow conversion at 59.2%.
As a brief aside, did you catch D&D’s definition of free cash flow conversion in their Value Creation Plan from November? You know, the one that produced a conversion figure of 85%:

The footnote reads:
Calculated as Adj. EBITDA less additions to intangible assets, purchases of property and equipment & payments for lease obligations / Adj. EBITDA
Adjusted EBITDA in the numerator and denominator — ummmm.
A lot of Engine Capital’s turnaround of D&D will hinge on their ability to pare acquisition & restructuring charges and capital expenditures (specifically, the additions to intangibles portion of capital expenditures). This, in turn, will improve free cash flow conversion, which will help lighten the debt burden, which will reduce quarterly interest expense, which will increase CFADS, which will help lighten the debt burden, which will reduce quarterly interest, etc. — truthfully, the flywheel which I wish would’ve materialized sooner (while I was a shareholder). I digress.
As with forecasting D&D’s revenue, forecasting expenses will likely be very touch-and-go. By this, I mean that expense forecasting should be updated quarterly as new information is revealed.
For estimating cash taxes, I take an average of the eight trailing quarters and arrive at $6.6 million. For acquisition & restructuring charges, I presume D&D was commingling operating expenses into the line item, so I step them down just $250 thousand a quarter, from $8 million in Q2 FY2025 to $6.3 million in the model’s final quarter. I hold the change in net working capital to a draw on cash of $1 million per quarter.
Similar to acquisition & restructuring charges, I assume capital expenditures declines by $250 thousand a quarter, from $6 million in Q2 FY2025 to $4.3 million in Q1 FY2027. Lastly, I assume payments for lease obligations increases by $20 thousand a quarter, from $1.8 million in Q2 FY2025 to $1.9 million in Q1 FY2027.
The model forecasts adjusted EBITDA through the adjusted EBITDA margin, so cash operating expenses, which is the difference between revenue and adjusted EBITDA, isn’t forecastable.
2.3.2 Adjusted EBITDA Margin

What I’ve attempted to do is disaggregate D&D’s adjusted EBITDA margin by its segments, which are set based on the revenue decomposition I previously discussed. To accomplish this, I make use of D&D’s publicly available subsidiary financials, since D&D only reports its consolidated adjusted EBITDA margin in its financials.
The United Kingdom financials of D&D and TMG are available through Companies House, whereas D&D’s Australian financials are available, for purchase, through ASIC.
2.3.2.1 Adjusted EBITDA Margin: TM Group
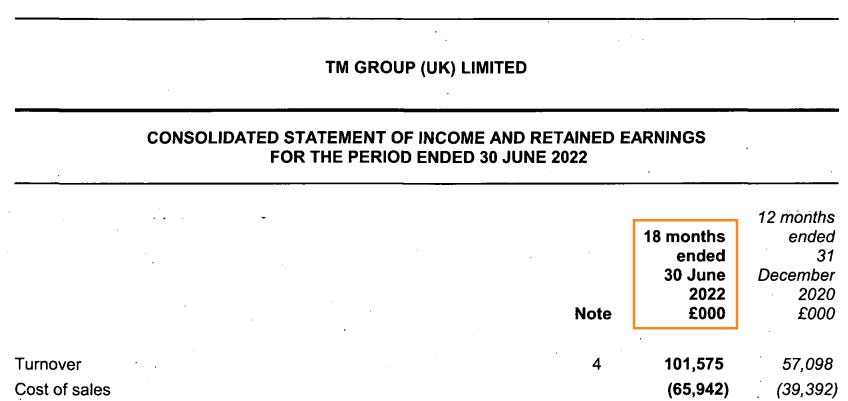
TMG’s fiscal year end comports to D&D’s June 30 fiscal year end. On Companies House, TMG is listed as TM Group (UK) Limited, company number 05278187. TMG’s latest financials are from FY2023 — its adjusted EBITDA margin can be determined using the following pages:
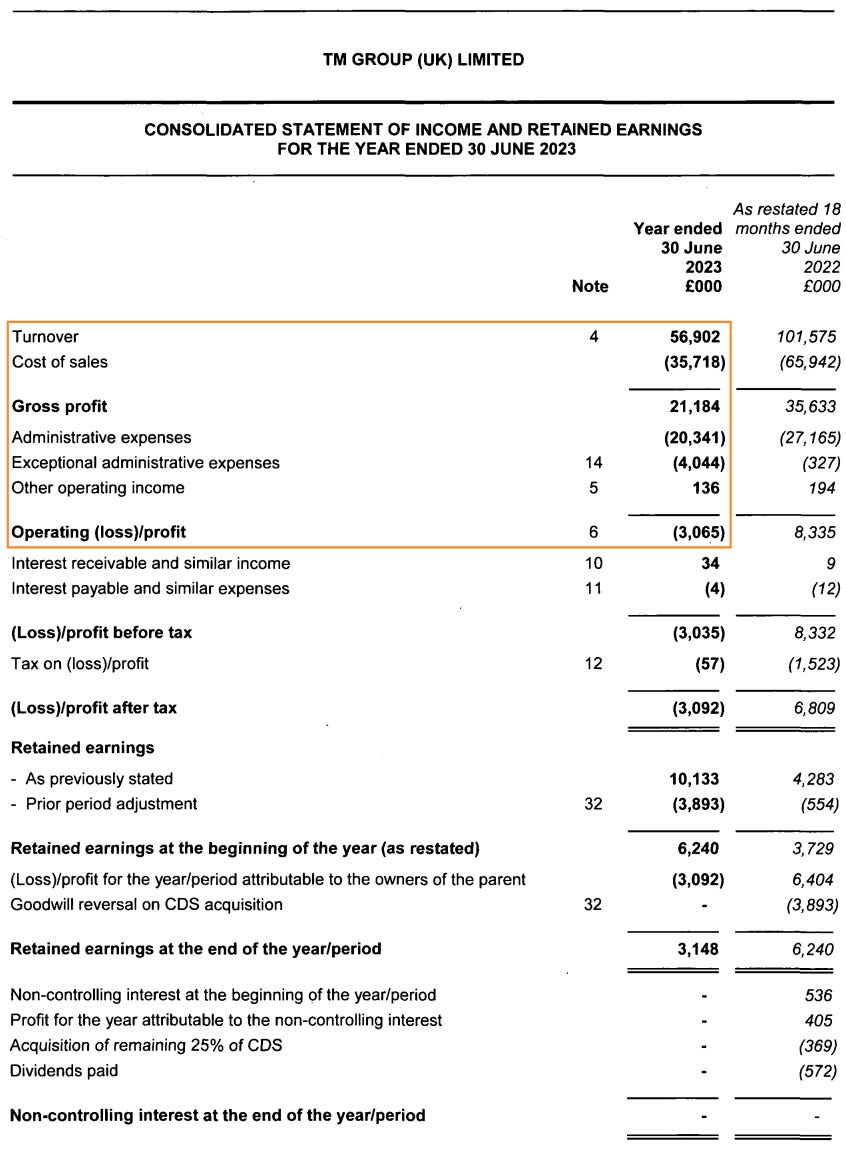
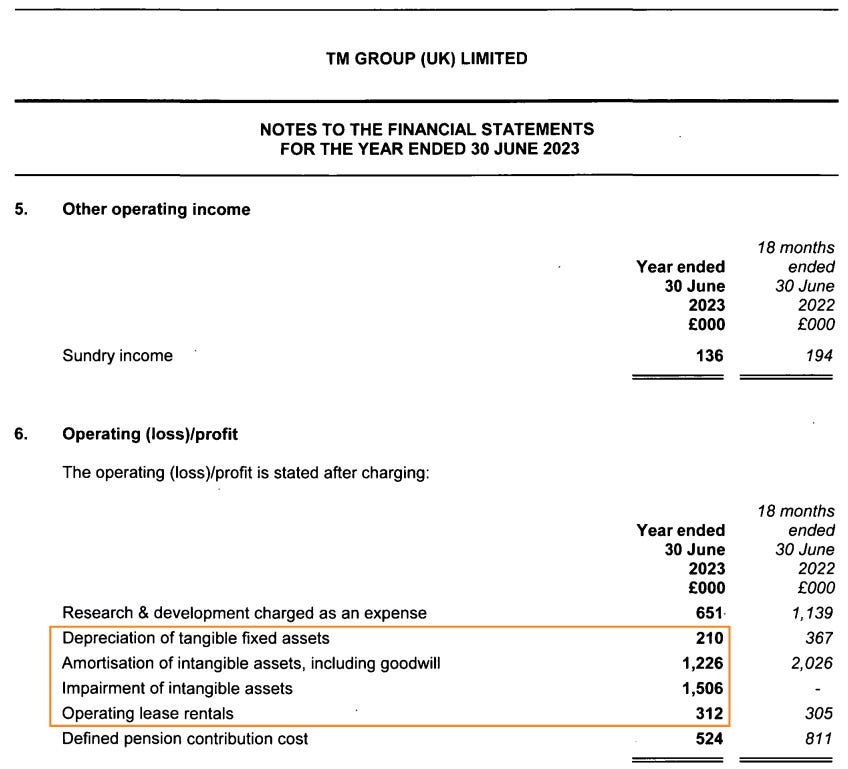
I calculate TMG’s adjusted EBITDA as £4.2 million for FY2023:
# Units: Thousands

Revenue                            56,902
− Cost of Sales                   (35,718)
= Gross Profit                     21,184

− Administrative Expenses         (20,341)
+ Other Operating Income              136
= EBIT                                979

+ Depreciation                        210
+ Amortization                      1,226
= EBITDA                            2,415

+ Impairment                        1,506
+ Operating Lease Rentals             312
= Adjusted EBITDA                   4,233

Adjusted EBITDA                     4,233
÷ Revenue                          56,902
= Adjusted EBITDA Margin                0.0744
Taken at face value, the adjusted EBITDA margin would appear to be around 7.4% (£4.2 million ÷ £56.9 million). Upon further investigation, and as clarified in note 2.5, the reason this figure is so low is because TMG reports revenue on a gross basis and excludes the impact of taxes:

As you’ll see with Australia, government fees and taxes are material.
As noted in D&D’s Canadian IFRS financials, transaction revenue (the kind generated by TMG) is recognized net of sales taxes and government fees:

To determine the net revenue figure off which to calculate TMG’s adjusted EBITDA, I refer to D&D’s Q4 FY2024 MD&A, which places TMG’s FY2023 (net) revenue at $56.1 million:

Note that the difference between D&D’s reporting of TMG’s FY2023 revenue ($56.1 million) and TMG’s FY2023 financials on Companies House (£56.9 million) helps confirm the different basis on which revenue is reported.
By translating TMG’s adjusted EBITDA using the average GBP/CAD over FY2023, I’m able to place it at approximately $6.8 million, resulting in an adjusted EBITDA margin of 12.2%:
# Units: Thousands

# GBP/CAD Over Quarter Ended:
2022-09-30                              1.535
2022-12-31                              1.595
2023-03-31                              1.643
2023-06-30                              1.681
= FY2023 Average                        1.614

FY2023 Average GBP/CAD                  1.614
× GBP Adjusted EBITDA               4,233
= CAD Adjusted EBITDA               6,831

CAD Adjusted EBITDA                 6,831
÷ CAD Revenue                      56,100
= Adjusted EBITDA Margin                0.1217
Since TMG’s FY2024 financials are unavailable, I use 12.2% as the adjusted EBITDA margin for all available quarters in FY2023, as well as Q1 FY2024:

Recall that D&D was forced to sell TMG, and did so in Q1 FY2024.
2.3.2.2 Adjusted EBITDA Margin: Australia
D&D’s Australian financials consolidate RET and NON revenue sources, so all that I’m able to determine is an adjusted EBITDA margin at the country-level. As with TMG, D&D’s latest Australian financials are from FY2023 and they also adhere to D&D’s fiscal year end. On ASIC, D&D’s main Australian subsidiary is listed as Dye & Durham Holdings Pty Ltd, company number 87646897412. Adjusted EBITDA can be determined using the following page:
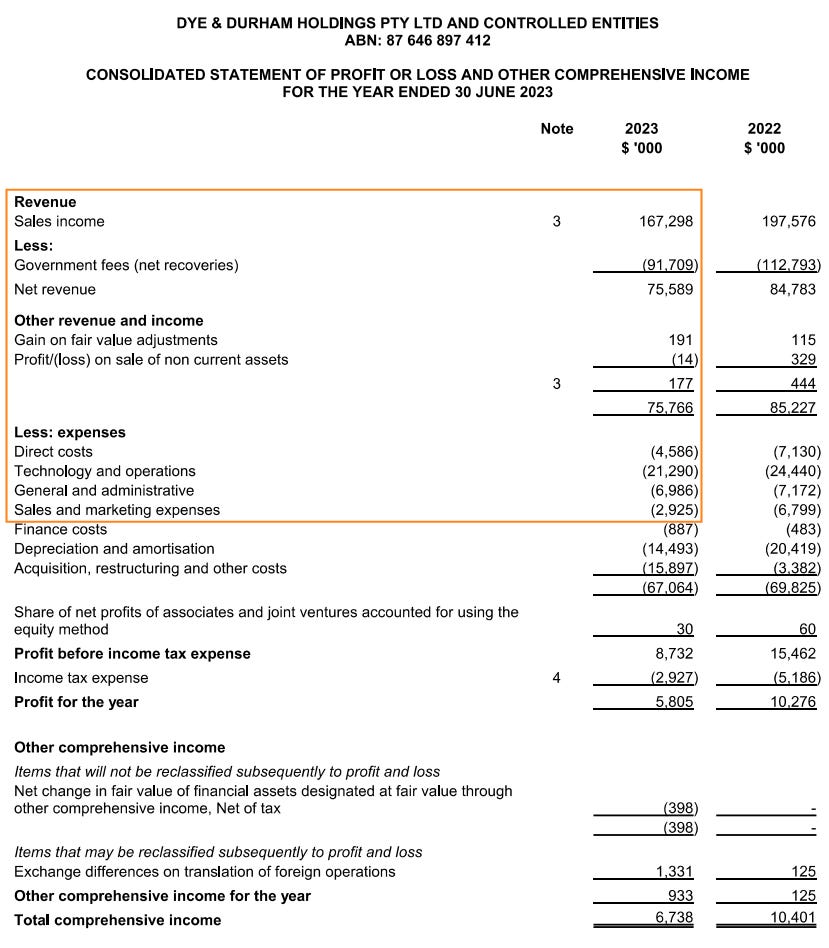
As mentioned, note the significant amount of government fees.
I calculate D&D’s Australian adjusted EBITDA margin as 52.8% for FY2023:
# Units: Thousands

Net Revenue                        75,766
− Direct Costs                     (4,586)
= Gross Profit                     71,180

− Technology and Operations       (21,290)
− General and Administrative       (6,986)
− Sales and Marketing Expenses     (2,925)
= Adjusted EBITDA                  39,979

Adjusted EBITDA                    39,979
÷ Net Revenue                      75,766
= Adjusted EBITDA Margin                0.5277
To confirm Dye & Durham Holdings Pty Ltd represents all of D&D’s reported Australian revenue, I determine the weight of D&D’s IFRS reported Australian revenue from FY2023, then proportion Dye & Durham Holdings Pty Ltd’s reported revenue. Next, I multiple the proportined revenue by the average cross rate over the quarter to translate the figure to Canadian dollars, then sum the quarters.
I end up with an that’s $760 thousand higher than D&D’s reported Australian revenue, confirming Dye & Durham Holdings Pty Ltd encompasses all of D&D’s reported Australian revenue:
# Units: Thousands

# AUS Revenue Weights by Quarter:
2022-09-30                              0.2539
2022-12-31                              0.2548
2023-03-31                              0.2489
2023-06-30                              0.2425
= FY2023 AUS Total                      1.0000

# D&D Holdings Pty Ltd Revenue Weighted by Quarter:
2022-09-30                         19,233
2022-12-31                         19,302
2023-03-31                         18,858
2023-06-30                         18,373
= AUD Revenue                      75,766

# AUD/CAD Over Quarter Ended:
2022-09-30                              0.892
2022-12-31                              0.892
2023-03-31                              0.925
2023-06-30                              0.897

# CAD AUS Revenue Weighted by Quarter:
2022-09-30                         17,154
2022-12-31                         17,222
2023-03-31                         17,438
2023-06-30                         16,489
= ~D&D AUS CAD Revenue             68,303

~D&D AUS CAD Revenue               68,303
D&D Actual AUS CAD Revenue         67,543
Δ Estimate vs. Actual                 760
2.3.2.3 Adjusted EBITDA Margin: United Kingdom
A brief word: D&D’s web of subsidiaries in the United Kingdom is extensive. By my count, there have been at least 65 entities that were under D&D’s umbrella at some point, though many now have been struck off the Companies House registry. These include:
Dye & Durham (UK) Holdings Limited
Dye & Durham (UK) Limited
Dye & Durham Formations and Entity Management
R-Squared BidCo Limited
TM Group (UK) Limited
Easy Convey Limited
7side Information Limited
7side Limited
Blue Sky Formations Limited
Brady & Co (Law Searchers) Ltd.
Brighton Company Formations Limited
Conveyancing Data Services Limited
Credas Technologies Ltd
Dye & Durham Directors Limited
Dye & Durham Ireland (formerly Hibernian Legal (International) Ltd)
Dye & Durham Secretarial Limited
Eurolife Company Services Limited
Formations Direct Limited
Future Climate Info Limited
Fylde Legal Services Limited
GlobalX (UK) Limited
GlobalX Limited
Handy Searches Limited
Hanover Company Formations Limited
Hanover Company Services Limited
HIPS (GMC) Limited
Homeinfo UK Limited
Humber Legals Limited
Index Franchising Limited
Index Insure Limited
Index PI Group Limited
Index Property Information Limited
Index Property Searches (East Central) Limited
Insight Legal Software Limited
Inspex.Info Limited
JH Management Services Limited
JH VAT Services Limited
JML Legal Services Limited
Jurito Limited
Keyhouse Computing Limited
Keyhouse Holdings Limited
Knapford Legal Services
Limited Lawlink (UK) Limited
Lawyer Checker Limited
Legalinx Limited
Limited Company Restorations Limited
Matter Centre Limited
Open Practice Limited
Penina Services Limited
Practical Vision Limited
PSG Client Services Limited
PSG Connect Limited
QF Registrars Limited
Quick Formations Limited
Quill Pinpoint Limited
Rochford Brady Legal Services Limited
Severnside Company Services Limited
Terrafirma IDC Limited
The Move Exchange Limited
TM Property Searches Limited
TM Search Choice Limited
TM Ventures Limited Urbispro Limited
York Place Company Services Limited
York Place Second Nominees Limited
The two most important subsidiaries in the United Kingdom are:
Dye & Durham (UK) Holdings Limited, company number 11844231
Dye & Durham (UK) Limited, company number 06029390
To confuse you further, Dye & Durham (UK) Holdings Limited was formerly named Dye & Durham (UK) Limited. At that time, Dye & Durham (UK) Limited was named Property Information Exchange Limited.
Dye & Durham (UK) Holdings Limited’s latest available financials are from FY2023. Unfortunately, Dye & Durham (UK) Holdings Limited stopped disclosing consolidated financials in their latest accounts, so no income statement is available:
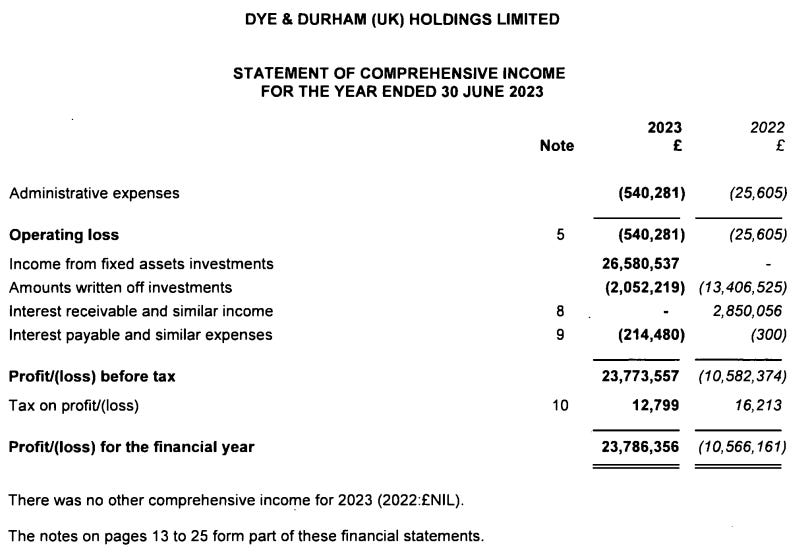
Beginning in FY2023, Dye & Durham (UK) Holdings Limited began making use of a reporting exemption, as indicated in note 2.3 of their notes to the financials:
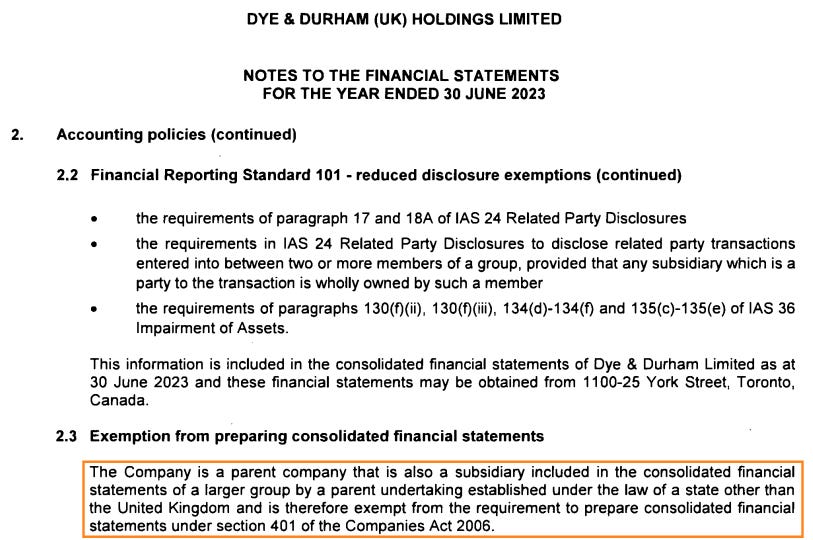
Due to reporting exemptions, for Dye & Durham (UK) Holdings Limited and other United Kingdom subsidiaries, it’s all but impossible to reconcile D&D’s reported United Kingdom revenue with Companies House accounts. I look elsewhere to determine D&D’s United Kingdom adjusted EBITDA margins beyond TMG.
Fortunately, the reporting exemption wasn’t in place in FY2022.
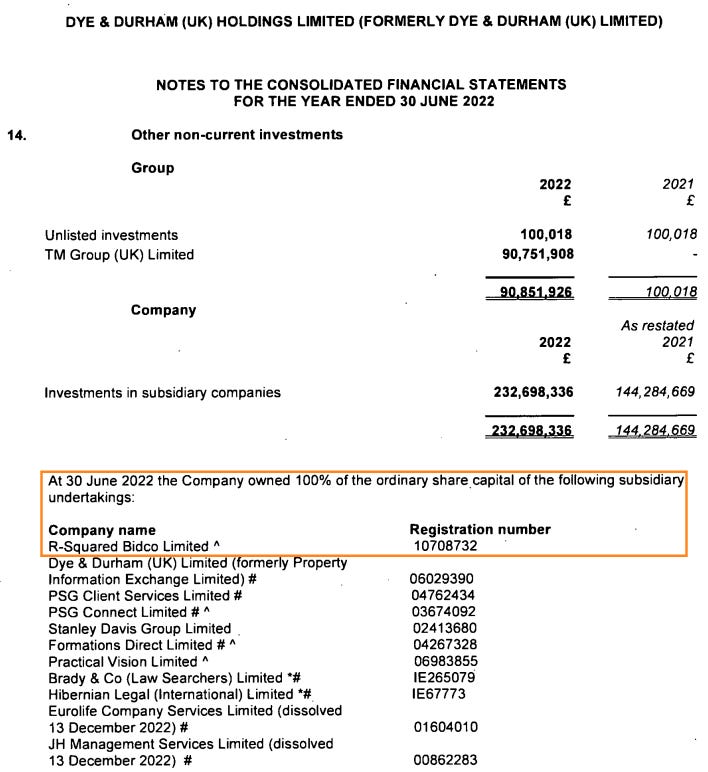
Per D&D’s Q4 FY2022 financials, its consolidated subsidiaries in the United Kingdom included Dye & Durham (UK) Limited, R-Squared Bidco Limited, and TMG:

This suggests D&D’s FY2022 United Kingdom revenue of $141.1 million should equal the combined revenue of:
Dye & Durham (UK) Limited
R-Squared Bidco Limited
TM Group (UK) Limited
Note that the fact that D&D reports its United Kingdom consolidated subsidiary as Dye & Durham (UK) Limited is possibly incorrect — it (potentially) should be Dye & Durham (UK) Holdings Limited. This is possibly a holdover from when Dye & Durham (UK) Holdings Limited used to be named Dye & Durham (UK) Limited.
In Dye & Durham (UK) Limited’s FY2022 accounts, it states its parent company as R-Squared Bidco Limited, as well as mentioning that R-Squared Bidco Limited is wholly owned by Dye & Durham (UK) Holdings Limited:

In its FY2022 financials, Dye & Durham (UK) Holdings Limited states that it consolidates R-Squared Bidco:
To summarize, Dye & Durham (UK) Limited lists its parent company as R-Squared Bidco Limited and Dye & Durham (UK) Holdings Limited consolidates R-Squared Bidco Limited. This suggests that Dye & Durham (UK) Holdings Limited is the TopCo, and beneath it sits R-Squared Bidco, and beneath R-Squared Bidco sits Dye & Durham (UK) Limited. Despite this, in FY2022 (and onward), D&D lists Dye & Durham (UK) Limited in its IFRS financials, but not Dye & Durham (UK) Holdings Limited.
In FY2022, Dye & Durham (UK) Holdings Limited reported revenue of £44.4 million:

Bringing this home, taking into account the structure of D&D’s United Kingdom subsidiaries, D&D’s FY2022 United Kingdom revenue of $141.1 million should equal the combined revenue of:
Dye & Durham (UK) Holdings Limited
TMG
As you may have noticed when I covered TMG’s Companies House accounts, their FY2022 financials are 18 months, rather than a single year:
This is because TMG’s fiscal year end was extended to comport to D&D’s June 30 year end upon its acquisition by D&D. Rather than dividing TMG’s FY2022 revenue by 1.5 to prorate revenue, I refer to D&D’s Q4 FY2022 MD&A where TMG’s FY2022 revenue is placed at less than 14% of D&D’s total revenue:

Assuming TMG’s share of D&D’s FY2022 revenue was 13.5% results in TMG’s FY2022 revenue being $64.1 million. There now is enough information to state that Dye & Durham (UK) Holdings Limited’s revenue in Canadian dollars should be approximately $77.1 million (D&D’s IFRS-reported United Kingdom revenue minus TMG’s revenue; $141.1 million – $64.1 million).
Recall that Dye & Durham (UK) Holdings Limited’s revenue in FY2022 was £44.4 million. To convert £44.4 million to Canadian dollars, I perform a similar exercise to the one done to translate Dye & Durham Holdings Pty Ltd. I weight the £44.4 million based on the proportional amount of United Kingdom revenue D&D generated during each quarter of FY2022, then translate that amount using the average cross rate over the quarter. Doing this places Dye & Durham (UK) Holdings Limited’s translated revenue at $74.7 million — very close to the $77.1 million gap between D&D’s FY2022 United Kingdom revenue ($141.1 million) less TMG’s FY2022 revenue ($64.1 million):
# Units: Actual

# UK Revenue Weights by Quarter:
2021-09-30                              0.2603
2021-12-31                              0.2328
2022-03-31                              0.2392
2022-06-30                              0.2677
= FY2022 UK Total                       1.0000

# D&D UK Holding Limited Revenue Weighted by Quarter:
2021-09-30                     11,549,952
2021-12-31                     10,329,731
2022-03-31                     10,613,710
2022-06-30                     11,878,303
= GBP Revenue                  44,371,696

# GBP/CAD Over Quarter Ended:
2021-09-30                              1.737
2021-12-31                              1.699
2022-03-31                              1.700
2022-06-30                              1.603

# CAD UK Revenue Weighted by Quarter:
2021-09-30                     20,062,267
2021-12-31                     17,550,213
2022-03-31                     18,043,307
2022-06-30                     19,040,920
= CAD Revenue                  74,696,707

D&D UK Hld Ltd CAD Revenue     74,696,707
+ TMG CAD Revenue              64,100,000
= ~D&D UK CAD Revenue         138,796,707

~D&D UK CAD Revenue           138,796,707
D&D Actual UK CAD Revenue     141,075,000
Δ Estimate vs. Actual          (2,278,293)
This was a drawn out way of demonstrating that Dye & Durham (UK) Holdings Limited’s FY2022 financials account for (essentially) all of the non-TMG portion of D&D’s IFRS-reported United Kingdom revenue. As a result, Dye & Durham (UK) Holdings Limited’s FY2022 financials can be used to inform segment-level adjusted EBITDA margins.
Recall that Dye & Durham (UK) Holdings Limited doesn’t disclose its income statement in its FY2023 financials.
I refer to the following pages of Dye & Durham (UK) Holdings Limited’s FY2022 financials to estimate its adjusted EBITDA margin:


Note that Dye & Durham (UK) Holdings Limited clarifies that revenue (turnover) represents net invoiced fees — suggesting revenue is reported on a net basis, unlike TMG:

For Dye & Durham (UK) Holdings Limited, I calculate its FY2022 adjusted EBITDA margin as 31.9%:
# Units: Actual

Revenue                        44,371,696
− Cost of sales               (10,578,364)
= Gross Profit                 33,793,332

− Administrative expenses     (31,093,252)
= EBIT                          2,700,080

+ Depreciation of PPE             329,291
+ Amortization of ROU assets      789,080
+ Amortization of intangibles  10,352,718
= Adjusted EBITDA              14,171,169

Adjusted EBITDA                14,171,169
÷ Revenue                      44,371,696
= Adjusted EBITDA margin                0.3194
Despite Dye & Durham (UK) Holdings Limited not reporting consolidated financials for FY2023, Dye & Durham (UK) Limited does report a portion of D&D’s United Kingdom revenue — £22.3 million, also on a net basis.
As a point of reference, D&D reported $127.2 million in United Kingdom revenue in FY2023. Excluding TMG’s revenue of $56.1 million places the remaining portion of United Kingdom revenue at $71.1 million — far above the £22.3 million translated to Canadian dollars (equal to $36 million performing the same revenue-weighted translation exercise as before).
Just to be thorough and to have an additional point of reference, I calculate Dye & Durham (UK) Limited’s adjusted EBITDA margin, doing so by referring to the following pages in their FY2023 financials:


For Dye & Durham (UK) Limited, I calculate its FY2023 adjusted EBITDA margin as 23.3%:
# Units: Actual

Revenue                        22,296,804
− Cost of sales                (4,172,034)
= Gross Profit                 18,124,770

− Administrative expenses     (14,274,570)
= EBIT                          3,850,200

+ Amortization of intangibles   1,161,102
+ Depreciation of tangles         190,873
= Adjusted EBITDA               5,202,175

Adjusted EBITDA                 5,202,175
÷ Revenue                      22,296,804
= Adjusted EBITDA margin                0.2333
2.3.2.4 Adjusted EBITDA Margin: Assessing Australia & the UK Together
To recap, the available data for D&D’s adjusted EBITDA margin from Australia and the United Kingdom is as follows:
FY2022:
United Kingdom: 31.9%
Based on >98% of D&D’s non-TMG United Kingdom revenue
Financials from Dye & Durham (UK) Holdings
FY2023:
Australia: 52.8%
Based on ~100% of D&D’s Australian revenue
Financials from Dye & Durham Holdings Pty Ltd
United Kingdom: 23.3%
Based on <51% of D&D’s non-TMG United Kingdom revenue
Financials from Dye & Durham (UK) Limited
Dye & Durham (UK) Holdings’ income statement isn’t disclosed
When grouping the United Kingdom and Australia, the United Kingdom represents 65% of revenue. TMG’s low adjusted EBITDA margin suggests that the adjusted EBITDA margin for United Kingdom conveyancing (i.e., the United Kingdom part of IN-RET) is also low. A revenue-weighted average puts the collective adjusted EBITDA margin of IN-RET and IN-NON at around 39.2% (65% United Kingdom revenue share × 31.9% United Kingdom adjusted EBITDA margin + 35% Australia revenue share × 52.8% Australia adjusted EBITDA margin). I set the adjusted EBITDA margin of IN-RET to 40% in Q2 FY2023, then step it down to 38% as of the most recent quarter:

For IN-NON, I set the adjusted EBITDA margin to 50%, then step it down to 48%:
2.3.2.5 Adjusted EBITDA Margin: South Africa
There’s very little to go on regarding South Africa’s adjusted EBITDA margin. Since GhostPractice is legal practice management software, I arbitrarily assign it a 40% adjusted EBITDA margin:

Given how little revenue is generated from South Africa, this assumption doesn’t have a meaningful impact on the model.
2.3.2.6 Adjusted EBITDA Margin: Canada
With Canada (CA-RET, CA-NON) left as the only geography for which adjusted EBITDA margins need to be assigned, the exercise partially becomes one of trial and error, where the inputs used can be assessed against D&D’s consolidated reported adjusted EBITDA margin:

As far as I can tell, the adjusted EBITDA margins of the Canadian segments haven’t been explicitly discussed on earnings calls, nor have they been spoken to in D&D’s MD&A. To inform my attribution of segment margins, I consider a mosaic of information in conjunction with the trial-and-error process I’ve just outlined.
2.3.2.6.1 Adjusted EBITDA Margin: Canadian Real Estate Transaction
In 2012, while acting as a financial advisor, the soon-to-be CEO of OneMove, Serge Salagar (Serge), estimated that OneMove’s theoretical adjusted EBITDA margin as a private company would be in the >85% range. Recall that OneMove was the platform upon which D&D was built. Matt became CEO of the company in March 2014, ousting Serge. This resulted in a legal battle that lasted years:

I’ve outlined EBITDA from Serge’s valuation report — note that EBITDA is what Serge has termed Gross Profit. We know he’s referring to EBITDA because of the EBITDA multiple valuation figure he cites ($0.93 million), which I’ve also outlined:

Serge reasoned that the continuing expenses to maintain the conveyancing software OneMove had developed would be minimal, given that the development expenses had been borne upfront. With a developed product and dominant market share, OneMove would be in a position to collect economic rents through price increases. Here’s Serge explaining OneMove’s price increases, enacted shortly after it was taken private:
Less than six months after OneMove was taken private, in an article on BIV, Serge boasted about enacting price increases that resulted in no churn:
Salager set about turning the company around, a process that included refocusing the company on marketing and sales and cutting staff and expenses.
In the space of a year and a half, Salager has returned the company to profitability. The business has expanded into Alberta and plans to soon be in Ontario.
The company’s product – software for the legal profession – was high quality, said Salager. He led a rebranding effort and increased the price, among other things, without losing any customers.
Further to the adjusted EBITDA margins on Canadian real estate conveyancing, in a recently released expert transcript with a former DoProcess employee, he disclosed that DoProcess’ EBITDA margin was around 75%. Recall that D&D acquired DoProcess for $530 million in 2020.
Ultimately, I assign a 70% adjusted EBITDA margin in Q2 FY2023 for CA-RET, stepping it down to 66% as of Q1 FY2025:

2.3.2.6.2 Adjusted EBITDA Margin: Canadian Non Real Estate Transaction
With only one row left to forecast, I’m able to rely on comparing my input to D&D’s reported adjusted EBITDA margin. For CA-NON, I use 66% as the adjusted EBITDA margin across the historical quarters:

Does such a high margin for CA-NON make sense? Making a heatmap of my revenue decomposition, and comparing it to changes in D&D’s adjusted EBITDA margin allows for this to be evaluated to a certain extent. Consider Q1 FY2024, where D&D reported a 57.2% adjusted EBITDA margin, up from 54.7% from the prior quarter:
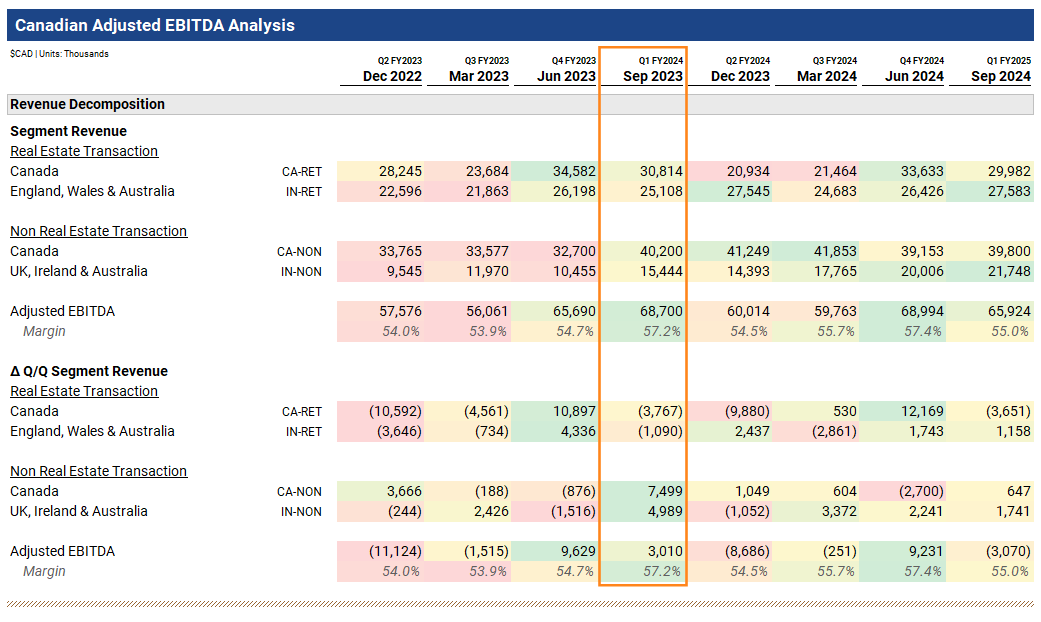
Despite high margin CA-RET revenue declining quarter-over-quarter, D&D posted a near record margin. Given what is known about Australian and United Kingdom margins, it’s likely that this can be attributed primarily to the high margin nature of CA-NON revenue.
2.3.2.7 Adjusted EBITDA Margin: All Segments

Taking everything together, I arrive at segment-level adjusted EBITDA margins which, collectively, approximate D&D’s reported adjusted EBITDA margin.
The tilde attached to the margin figure indicates its an estimate for historical quarters — the actual adjusted EBITDA margin is immediately below it, and the delta between the two below that.
For the forecasted quarters (Q2 FY2025 onward), I set them all to the adjusted EBITDA margin from Q1 FY2025:

The forecasted consolidated adjusted EBITDA margin (e.g., 55.8% in Q2 FY2025 and 56% in Q3 FY2025) changes over time because it’s impacted by the amount of revenue from the decomposed revenue segments.
It logically follows that incorporating divestitures can have a significant impact on the consolidated adjusted EBITDA margin, depending on whether the divested revenue is from a high or low margin segment. In my model, because I’m divesting the high margin Telus Payment business, which is CA-NON revenue, the adjusted EBITDA margin in quarters that follow the divestiture declines.
The final thing to consider is that there’s almost certainly a degree of expense misattribution on D&D’s part happening. It’s likely that should-be operating expenses are aggressively allocated to acquisition & restructuring charges and the additions to intangibles portion of capital expenditures. This has the obvious impact of boosting the adjusted EBITDA margin — likely by >10%. To account for this in the model as it’s been set it up, acquisition & restructuring expenses and capital expenditures should have floor values. As well, any exit valuation multiple or divestment multiple for sales proceeds made on an adjusted EBITDA basis should be conservatively estimated.
I considered nesting in a line above adjusted EBITDA to adjust D&D’s margin but decided it added unnecessary complexity.
Model Section 3. Debt Schedule Overview

Debt Schedule Overview is made up of three portions:
Cash Available for Debt Service
Debt Service
Debt Schedule & Interest Rate Curves
3.1 Cash Available for Debt Service

I make a distinction between cash available for debt service (CADS) and CFADS to more fairly evaluate D&D’s coverage of debt service and net interest. CFADS is an operating cash flow variant, whereas CADS includes CFADS, non-operating cash flow (from investments maturing and divestitures), as well as net cash on hand (i.e., surplus cash on the balance sheet) — a stock of cash, not a flow.
Net cash on hand is equal to the beginning cash balance minus customer advances minus an assumed minimum (operating) cash balance. The commingled cash corresponding to the customer advances liability must be netted against D&D’s beginning cash balance because D&D isn’t entitled to the cash. As stated in D&D’s Q4 FY2024 financials, they hold cash advanced by customers in a non-interest bearing account that’s repayable to customers on demand:

Historically, this balance has varied between $5 million and $18 million — I select $15 million as a simple (but arbitrary) middle ground and hold this assumption across the forecast. This results in D&D having $23.4 million of net cash on hand that is unencumbered and can be used to service debt.
Total cash flow is made up of non-operating cash flow and CFADS. Non-operating cash flow is the sum of proceeds from divestitures and proceeds from guaranteed investment certificate (GIC). Recall that D&D invested $185 million in a GIC that matures shortly before it has to retire its original convertible debentures, with a face value of $185 million too.
For Q2 FY2025, I have D&D generating $24.7 million in total cash flow — entirely from CFADS. In most quarters, total cash flow will be equal CFADS, unless there’s a divestiture or it’s the quarter in which D&D’s GIC matures (i.e., Q3 FY2026).
Total cash flow is added to net cash on hand to produce CADS. For Q2 FY2025, I have CADS equal to $48.2 million — $23.4 million from net cash on hand and $24.7 million from CFADS.
Because I’m not using any VBA in the model, one way to manually sculpt the debt schedule through the minimum cash balance. This explains the somewhat arbitrary values currently used for the minimum cash balance:

Consider the following example.
Had I set the minimum balance to a fixed value (in the image below, $30 million), the model would have swept the net cash on hand to paydown debt (this is set using the values in the green square. However, because D&D negative gears in certain quarters, the cash shortfall would need to be bridged through revolver draws:

Note the cadence in which the revolver has to be drawn down (pink box). This is owing to the senior secured note’s semiannual interest payment of $31.5 million.
By setting the minimum cash balance artificially high, D&D’s net cash on hand plus its total cash flow of $38.2 million is less than the sum of D&D’s net interest payment ($44.5 million) and mandatory principal repayment ($1.2 million) for Q2 FY2025, resulting in a cash shortfall of $7.5 million. This balance is drawn from the revolver. This paragraph is shown in the red box.
Without having to pay the senior secured note interest in Q3 FY2025, the $22.9 million in CADS is more than able to cover net interest expense and mandatory principal payments. The excess cash is used to pay off the revolver draw from the previous quarter, plus an additional $2.8 million of the term loan B. This paragraph is shown in the blue box.
Does it make sense to pay down $2.8 million of the term loan B if you’re going to negatively gear in Q4 FY2025 because you have the semiannual senior secure note interest to pay? Likely not. Again, to resolve this, you can play with the minimum cash balance. As well, and more appropriately, you can change the percent of swept cash used to paydown debt (green box). The revolver should always be set to 100% . Furthermore, the original and new convertible debentures should be set to 0% given the terms outlined in their respective credit agreements.
Parting from the example, I’ll now go back to using the modeled numbers.
3.2 Debt Service

As you just saw, CADS from the Cash Available for Debt Service portion flows down and is netted against net interest expense to produce cash available for principal repayment — equal to $3.8 million in Q2 FY2025. From this, mandatory principal repayments subtracted to produce cash available to sweep (needed to draw). If this balance is positive, it’s used to optionally paydown debt if the hardcoded percentages in the bottom left corner are greater than 0%. If cash available to sweep (needed to draw) is negative, the revolver is drawn down to bridge the shortfall. For Q2 FY2025, the cash available to sweep is $2.6 million ($3.8 million in cash available for principal repayment − $1.2 million in mandatory principal repayments).
Consider the following image from the model:

Since the model has been set to paydown the revolver, term loan B1, term loan B2, and senior secured notes (100% values; green box), any outstanding debt is paid down in that order. For Q2 FY2025, there isn’t a revolver balance to pay off (red box), so the model moves onto the term loan B1 (blue box). Since there’s more than $200 million of the term loan B1 outstanding, all $2.6 million of cash available to sweep (orange box) is used to pay it down.
3.3 Debt Schedule & Interest Rate Curves

The mandatory debt schedule reflects the amount of debt that must be repaid each quarter. The term loan B’s amount of quarterly amortization is disclosed in D&D’s Q1 FY2025 financials and is equal to $1.2 million:
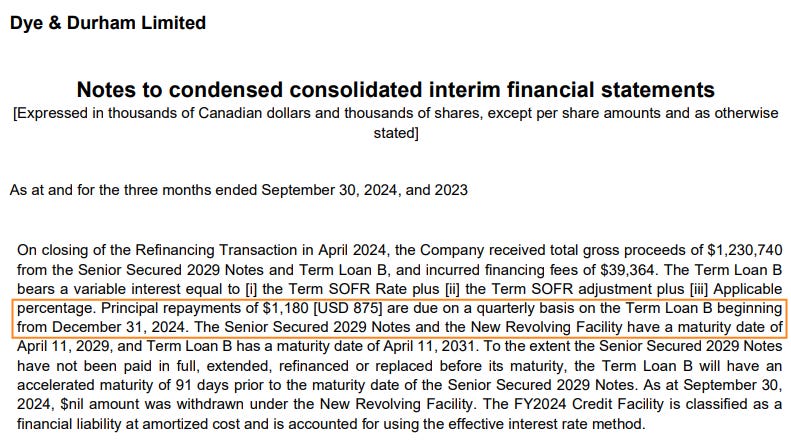
Since mandatory principal repayment is calculated based on a percentage of the beginning balance, I’ve backed into the $1.2 million quarterly payment by setting the percentage to 0.3%.
The original convertible debentures mature in Q3 FY2026, so the value is set to 100% in that quarter. I also reference that cell with respect to the maturity of D&D’s GIC. In Q1 FY2025, D&D invested $185 million into a GIC that matures shortly before the original convertible debenture:

The repayment schedule of holdbacks & contingent considerations is informed by the proportion of holdbacks that are current versus noncurrent on D&D’s latest balance sheet, from Q1 FY2025:

From the total amount of holdbacks, equal to $89.9 million ($63.1 million + $26.8 million), the current portion is approximately 70% ($63.1 million ÷ $89.9 million). I assume the current portion of holdbacks will be paid off in equal parts of 17.5% (70% ÷ 4) over the next four quarters. For the remaining 30%, I assume it’s paid off at a rate of 10% per quarter.
I also treat the $10 million of severance paid to Matt as a holdback (in form), adding it to the $89.9 million of acquisition-related holdbacks. Since I can’t find information on the cadence of payment, I assume it’s paid out over the next twelve months at $2.5 million a quarter.
The senior secured notes call schedule is based off data from Bloomberg:

The interest rate curves are likely proximate; I have taken values from random sites.
Model Section 4. Debt Securities
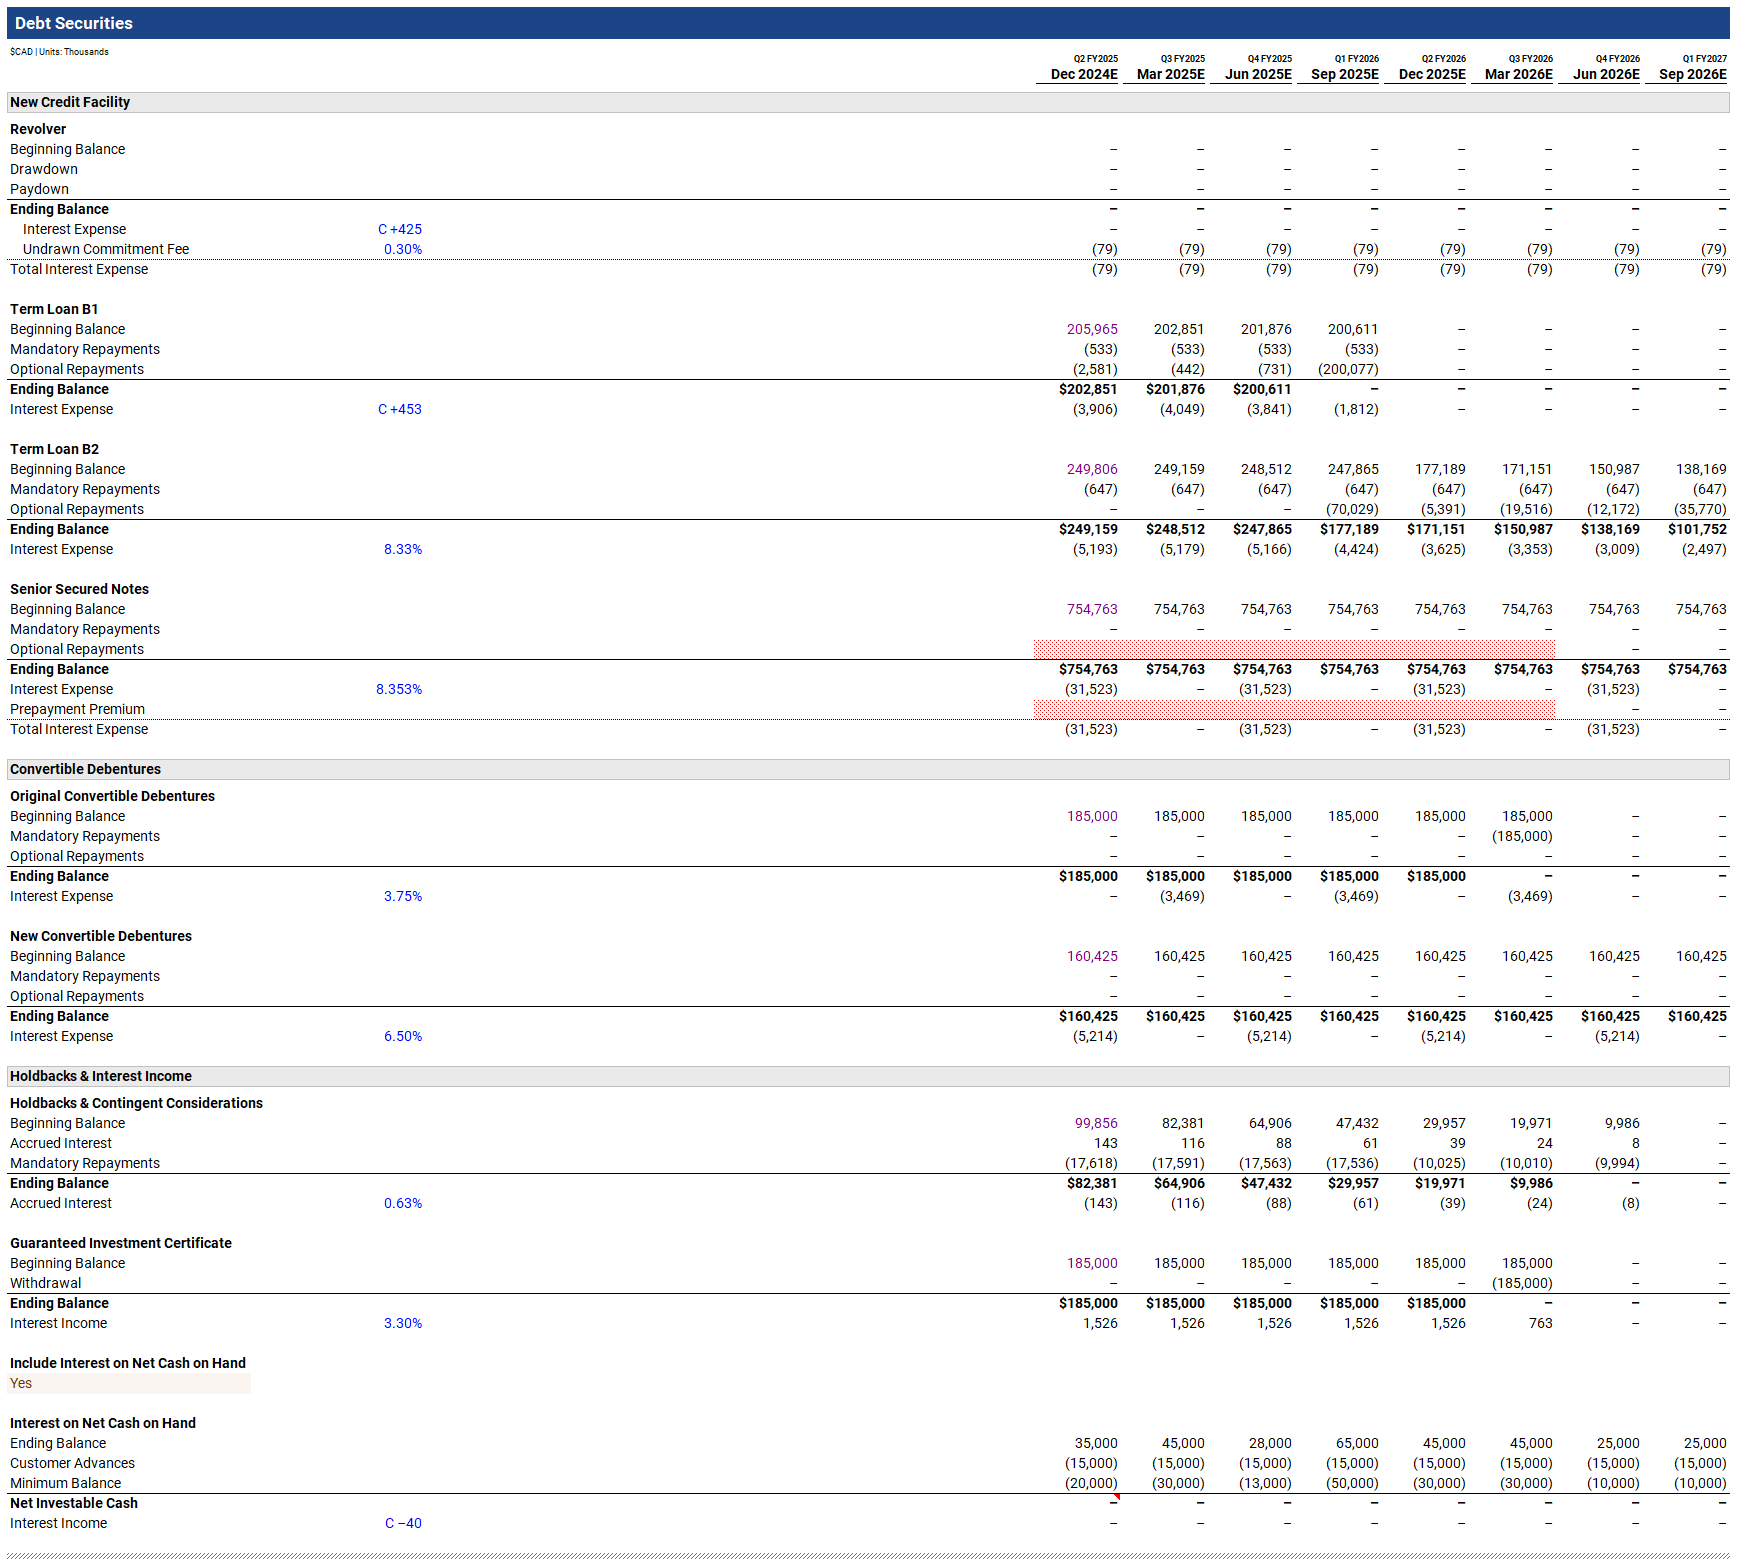
Debt Securities is broken up into three portions:
New Credit Facility
Convertible Debentures
Holdbacks & Interest Income
4.1 New Credit Facility

D&D’s new credit facility includes three securities:
Revolver
Term loan B
Senior secured notes
While D&D’s press releases and financials provide satisfactory details about the term loan B and senior secured notes, aside from the size of the the revolver, some details remain unclear. The new credit facility credit agreement clarifies that the revolver is multi-currency, with the interest rate applied to the revolving loan set based on the currency of the loan:
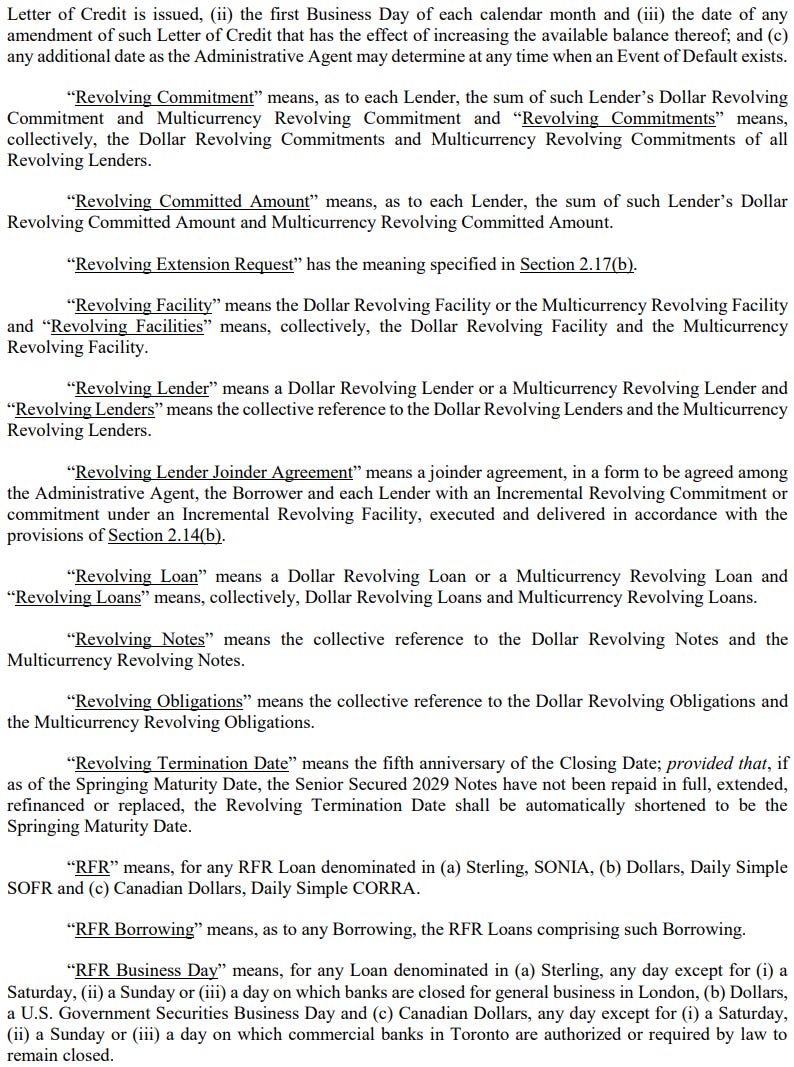
However, the spread to the reference rate applied to the loan is redacted in the credit agreement. I arbitrarily set it at 425 basis points above CORRA given that was the SOFR spread on the term loan B — this spread is likely a low estimate. I also assume an undrawn commitment fee of 0.3%. Now is when you’d presumably email IR to get these details but D&D’s IR has a habit of not replying to me. Don’t they know what I know about [C53107030ABDFAFEED225A56B8914CA8] and [9755188C852FBB9BEEEAB6B80EC094C2]?
I’ve broken the term loan B into term loan B1 and term loan B2 to account for the impact of the swap D&D entered into to, to hedge the currency and interest rates of the loan, since it’s a USD-based loan:
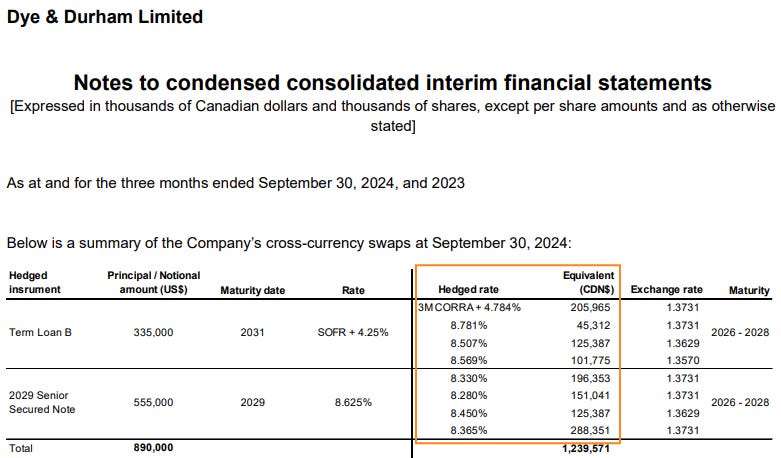
The term loan B1 bears an interest rate of 3 month CORRA + 4.784%. The weighted average interest rates of the term loan B2 and senior secured notes are 8.576% and 8.353%, respectively.
D&D recently disclosed that the SOFR spread at which the unhedged USD loan bears interest would be lowered by 25 basis points. It’s unclear to me how actual cash outlays work in light of the swap D&D entered into. To account for the 25 basis point decrease in the term loan B’s interest rate, I’ve simply lowered the hedged rate by 25 basis points on the term loan B1 and B2. This means the term loan B1 bears an interest rate of CORRA + 453 basis points and the term loan B2 bears an interest rate of 8.33%.
Speaking generally, the model assumes the swap is seamless in that D&D’s quarterly interest payments are made in the hedged currency (CAD) and any principal repayment results in a proportional amount of the swap being settled. Said differently, I’m assuming D&D isn’t bearing currency or interest rate risk from the base loan. As well, I’m assuming settling the swap doesn’t incur fees.
Since this model is based on cash, to determine the balances of the separate parts of the new credit facility, I can’t use the carrying value D&D reports on their balance sheet because it’s netted against issuance costs. Doing so would undercount cash interest expense. To get around this, I reference the amount of gross proceeds received arising from the new credit facility. This is disclosed as $1.2 billion in D&D’s Q1 FY2025 financials:

On the prior page, D&D discloses the gross amount of the term loan B, equal to $476 million:
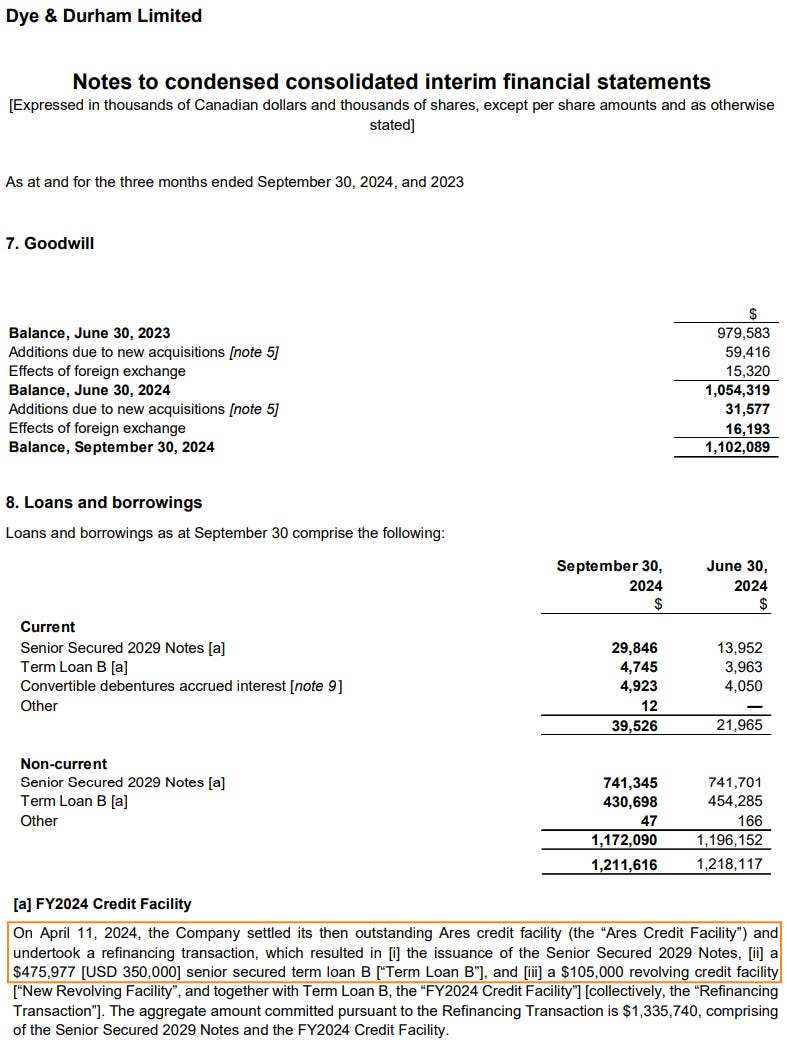
Because the revolver has an undrawn balance (i.e., $0), the gross amount of the senior secured notes is equal to the gross proceeds of the new credit facility minus the gross amount of the term loan B, or $754.8 million ($1.2 billion − $476 million).
As disclosed in D&D’s Q1 FY2025 financials, they repaid $20.2 million of the term loan B:
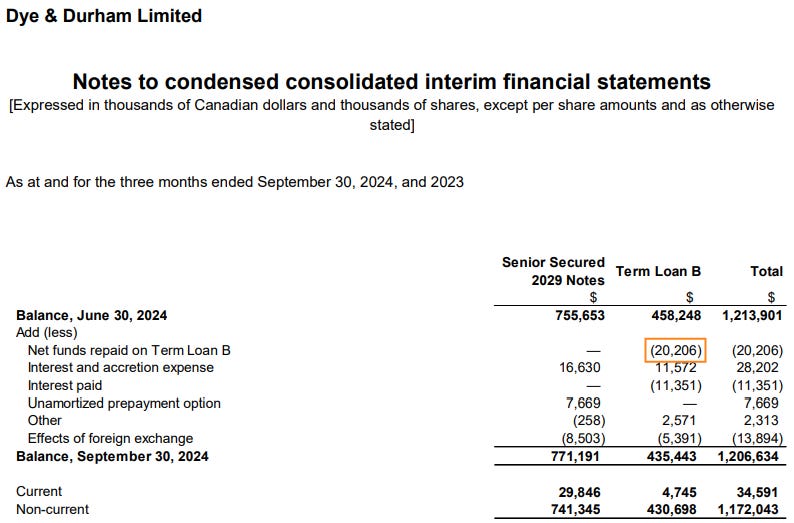
This places the the outstanding term loan B balance at $455.8 million as of the end of Q1 FY2025. When allocating the term loan B balance between B1 and B2, I decide to allocate $206 million to the term loan B1, which is the entire amount hedged at CORRA+. I allocate the remaining $249.8 million to the term loan B2.
The last thing to note is that the senior secured notes can’t be called until Q4 FY2026:
To the extent D&D pays down the senior secured notes, they must pay a premium as shown in the image above.
4.2 Convertible Debentures

The beginning balances of the original and new convertible debentures are their face values, rather than the balance they’re carried at on D&D’s balance sheet. This is done to calculate cash interest accurately.
Because the convertible debentures can’t be prepaid until their call, there isn’t much “movement” in the Convertible Debentures portion of Debt Securities:

I’ve included the optional repayment row as a “just in case.”
The original convertible debentures have an interest rate of 3.75%, payable semiannually in Q1 and Q3, and they mature in Q3 FY2026:

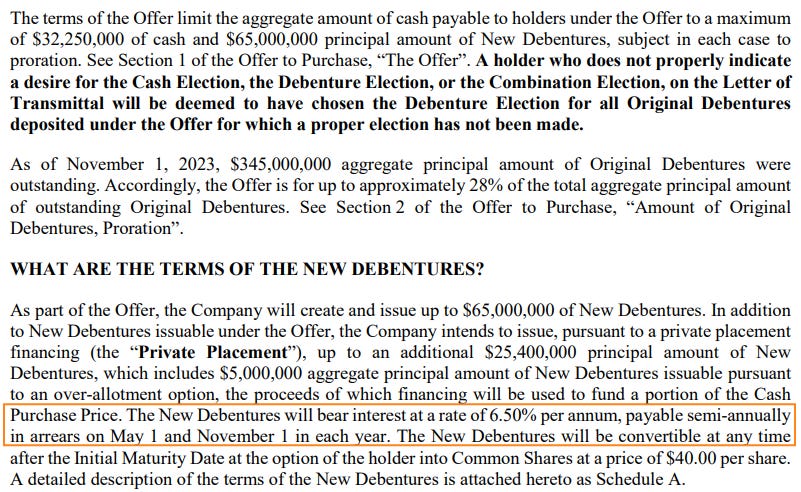
The new convertible debentures have an interest rate of 6.5%, payable semiannually in Q2 and Q4, and they mature in 2028 — beyond the model’s final quarter:
The balances in the model ($185 million of original convertible debentures and $160.4 million of new convertible debentures) reflect D&D’s convertible swap/refinancing transaction(s).
4.3 Holdbacks & Interest Income

For holdbacks, I assume a minimal amount of accrued interest at a rate of 0.6% based previous payments — this interest rate factors out the impact of adding Matt’s $10 million of severance to the total balance of holdbacks reported on D&D’s balance sheet. Said differently, the interest rate for accrued interest is only based on the amount of acquisition-related holdbacks.
I’ve outlined the cadence of holdback payments above; I’m assuming the current portion of holdbacks is paid off evenly over the next twelve months, with the non-current balance being paid off evenly over the three quarters that beginning in Q2 FY2026. The different amounts in the mandatory repayments line is owing to accrued interest. I assume Matt’s $10 million severance is paid out at a rate of $2.5 million a quarter.
The GIC mirrors the original convertible debentures in terms of its withdrawal. As far as I can tell, the interest rate on the GIC hasn’t been disclosed by D&D. I assume a rate of 3.3%.
I include the option to sweep net investable cash to generate interest income at CORRA − 40. This can be toggled using the dropdown in the brown-shaded cell, seen on the lower middle left of Holdbacks & Interest Income. This likely won’t come into play unless there is a material divestiture such that all of the term loan B is paid off, but is done earlier than when the senior secured notes are callable (beginning Q4 FY2026). All said, unlikely.
Model Section 5. Cash Flow Statement

The Cash Flow Statement was more of an afterthought — I’ve included it for completeness. Note that the historical ending cash & cash equivalents balance doesn’t balance without (insignificant) plug values. I cover the reason this is the case in Checks.
I’ve shaded out portions which this model doesn’t incorporate — acquisitions, for example.
Model Section 6. Valuation

Valuation has two portions:
Current Valuation
Forward Valuation
6.1 Current Valuation

Current Valuation bridges to enterprise value so that D&D’s current enterprise value multiples can be established to inform the exit multiple used in the Forward Valuation portion of the model.
The share price and basic shares outstanding is obtained from TMX. The number of basic shares outstanding differs slightly from D&D’s latest financials because I’m using the figure reported by TMX — I find TMX has the best up-to-date information on basic shares outstanding for Canadian companies.
The model determines fair value using enterprise value-level metrics and multiples (EV/Revenue, EV/Adjusted EBITDA, and EV/FCFF) — I’ve included the current P/FCFE multiple as well.
In my bridge to enterprise value, I’m making a few adjustments to establish what I believe is a more accurate representation of D&D’s true enterprise value:
I’m netting customer advances against D&D’s cash position because D&D isn’t entitled to the cash it receives upfront from customer advances.
I’m treating lease liabilities as debt. Under IFRS, leases flow through the income statement as interest expense and amortization. Since the denominator in my exit enterprise value calculations is always a metric calculated before interest and amortization (i.e., doesn’t deduct), I account for leases in the numerator.
Similar to leases, I’m treating holdbacks & contingent considerations as debt. Again, since the denominator in my exit enterprise value calculations is before holdback payments, I factor them in by adding the balance to the numerator.
All of these adjustments have the impact of increasing enterprise value — customer advances reduce cash, whereas lease liabilities and holdbacks increase debt. Since these changes increase enterprise value, they increase D&D’s enterprise-level market multiples.
If you don’t think these adjustments should be made, feel free to delete them, both in Current Valuation and Forward Valuation.
6.2 Forward Valuation

D&D’s valuation can be estimated using EV/Revenue, EV/Adjusted EBITDA, or EV/FCFF on a trailing, forward, or four quarters annualized basis by changing the brown-shaded cells in the top left. For demonstration purposes, I’ve selected EV/FCFF on a forward basis.
I’ve lightened the colouring of the font for the forecasted quarters between today and the model’s final forecasted quarter. As well, I’ve made the Q2 FY2025 column red because today’s date is now past the quarter’s end date, impacting the present value formula used in the model.
Since the model only forecasts quarters until Q1 FY2027, calculating forward metrics beginning in Q2 FY2026 requires simplification — there are only three modeled quarters forward of Q2 FY2026. To overcome this problem, I assume the missing quarters needed to calculate forward metrics are equal to the same fiscal quarter from the prior year multiplied by the organic growth input.
By way of example, consider the following image, where I’m valuing D&D as of Q4 FY2026 using forward FCFF of $169.1 million:

Since I’m using forward FCFF, I need FCFF from Q1 FY2027, Q2 FY2027, Q3 FY2027, and Q4 FY2027. However, my model only has FCFF calculated for Q1 FY2027, equal to $42.1 million. To determine FCFF in Q2 to Q4 FY2027, I take FCFF from Q2 to Q4 FY2026 and multiply the sum by my organic growth estimate of 3%. The sum of Q2 to Q4 FY2026 FCFF is equal to $123.2 million:

Assuming $123.2 million increases organically by 3% results in an estimate of Q2 to Q4 FY2027 FCFF of $126.9 million. Adding $126.9 million to the modeled Q1 FY2027 FCFF figure of $42.1 million produces the $169.1 million forward FCFF metric as of Q4 FY2026.
Going back to Forward Valuation, I’ve set the enterprise multiple to 14.8x for the first and final estimated quarters (Q2 FY2025 and Q1 FY2027). For the intervening years, I’ve increased the exit multiple by 2x each quarter to demonstrate the impact of D&D’s dilutive options:

I use the treasury stock method to account for the impact of options. The amount of shares repurchased can be based on the share price calculated using basic or diluted shares outstanding (green boxes). Using diluted shares outstanding creates a circularity since the impact of dilution factors into the share price used to calculate the number of shares repurchased.
Using basic shares outstanding results in a higher price at which shares need to be repurchased. Since proceeds from options exercise is fixed, this results in fewer shares being repurchase (i.e., more dilution). Because there’s more dilution, the calculated undiscounted fair value is lower when basic shares outstanding is selected (assuming there’s dilution).
The number of options outstanding and the weighted-average exercise price is disclosed in D&D’s FY2024 management information circular:

Since this figure is from Q4 FY2024 and the TMX basic shares outstanding figure is current, I subtract the difference between the TMX-reported figure and the number basic shares outstanding as of Q4 FY2024, equal to 59.1 thousand (67 million TMX-reported shares − 66.9 million shares). D&D’s basic shares outstanding is reported in their Q1 FY2025 financials:

I also subtract the 4.8 million shares cancelled as a result of the separation agreement between D&D and Matt:

Collectively, this results in 9.2 million outstanding options (14 million options from the MIC − 59.1 thousand options to reconcile the TMX data − 4.8 million options cancelled under the separation agreement). The press release doesn’t clarify the exercise price of the cancelled options, so I leave it at $32.13.
The hurdle rate is used to discount the undiscounted fair value since it’s a future value. In effect, the hurdle rate can act as the cost of equity. I’ve set it to 20% in the model, which results in a fair value of $16.25/share. Goal seeking the hurdle rate to the current share price of $17.72 produces a cost of equity of 14.2%:

Model Section 7. Comparable Companies

Comparable Companies simply takes the reported multiples and metrics from an image I came across utilizing FactSet data, then incorporates the model’s calculated metrics and multiples for D&D.
Model Section 8. Summary Statistics

Summary Statistics consists of four portions:
Housing Metrics
Financial Metrics
Debt Metrics
Credit Metrics
These portions are self-explanatory and not worth delving into. They contain information from different parts of the model.
Model Section 9. Checks

Checks contains two portions:
Comparing Model to IFRS Financials
Ending Cash Bridge
9.1 Comparing Model to IFRS Financials

Here, I’ve taken the historical key metrics as calculated using D&D’s IFRS financials and compared them to the calculations I’ve arrived at using the model. You can see they’re largely the same, with two minor differences:
$141 thousand in extra cash flow from operations, which flows into other calculations that build off of it.
$653 thousand less, then more, in cash flow from operations, which flows into other calculations that build off of it.
These discrepancies are owing to:
Inconsistencies in D&D’s IFRS financials that aren’t captured in my abbreviated build to operating cash flow metrics.
The fact that I reconcile D&D’s cash flow statement so that quarters only show the quarterly impact.
In both instances, the discrepancies are very minor and arise from inconsistencies between D&D’s reporting of finance costs in the income statement and cash flow statement.
To see what I mean with respect to reconciling D&D’s cash flow statement, consider the D&D’s Q2 FY2023 financials.
D&D reports its quarterly income statement over three month intervals (except for Q4):
However, its cash flow statement is reported fiscal year to date:
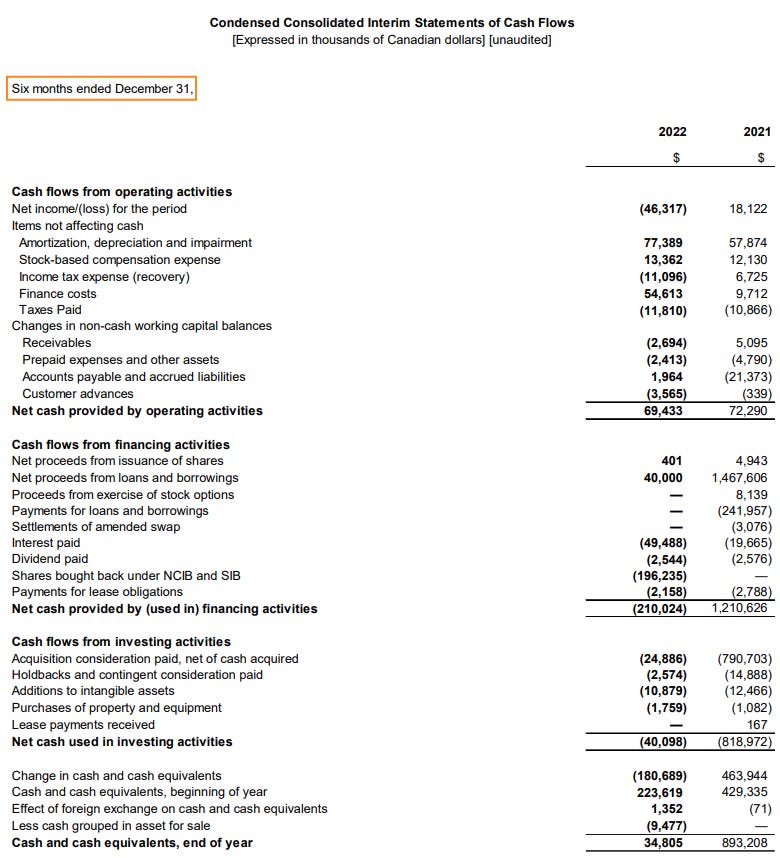
In my main model, I determine the quarterly cash flow statement by taking D&D’s reported cash flow statement line items and subtracting reported amounts from any previous quarters (to the enter they exist):

This is why Q1 columns are hardcoded values (blue), but Q2 to Q4 are formulas (black).
Again, the differences are historical and minor.
9.2 Ending Cash Bridge

Ending Cash Bridge bridges from beginning cash to ending cash, showing the impact that individual line items have on cash.
Model Section 10. Lists & Lookups
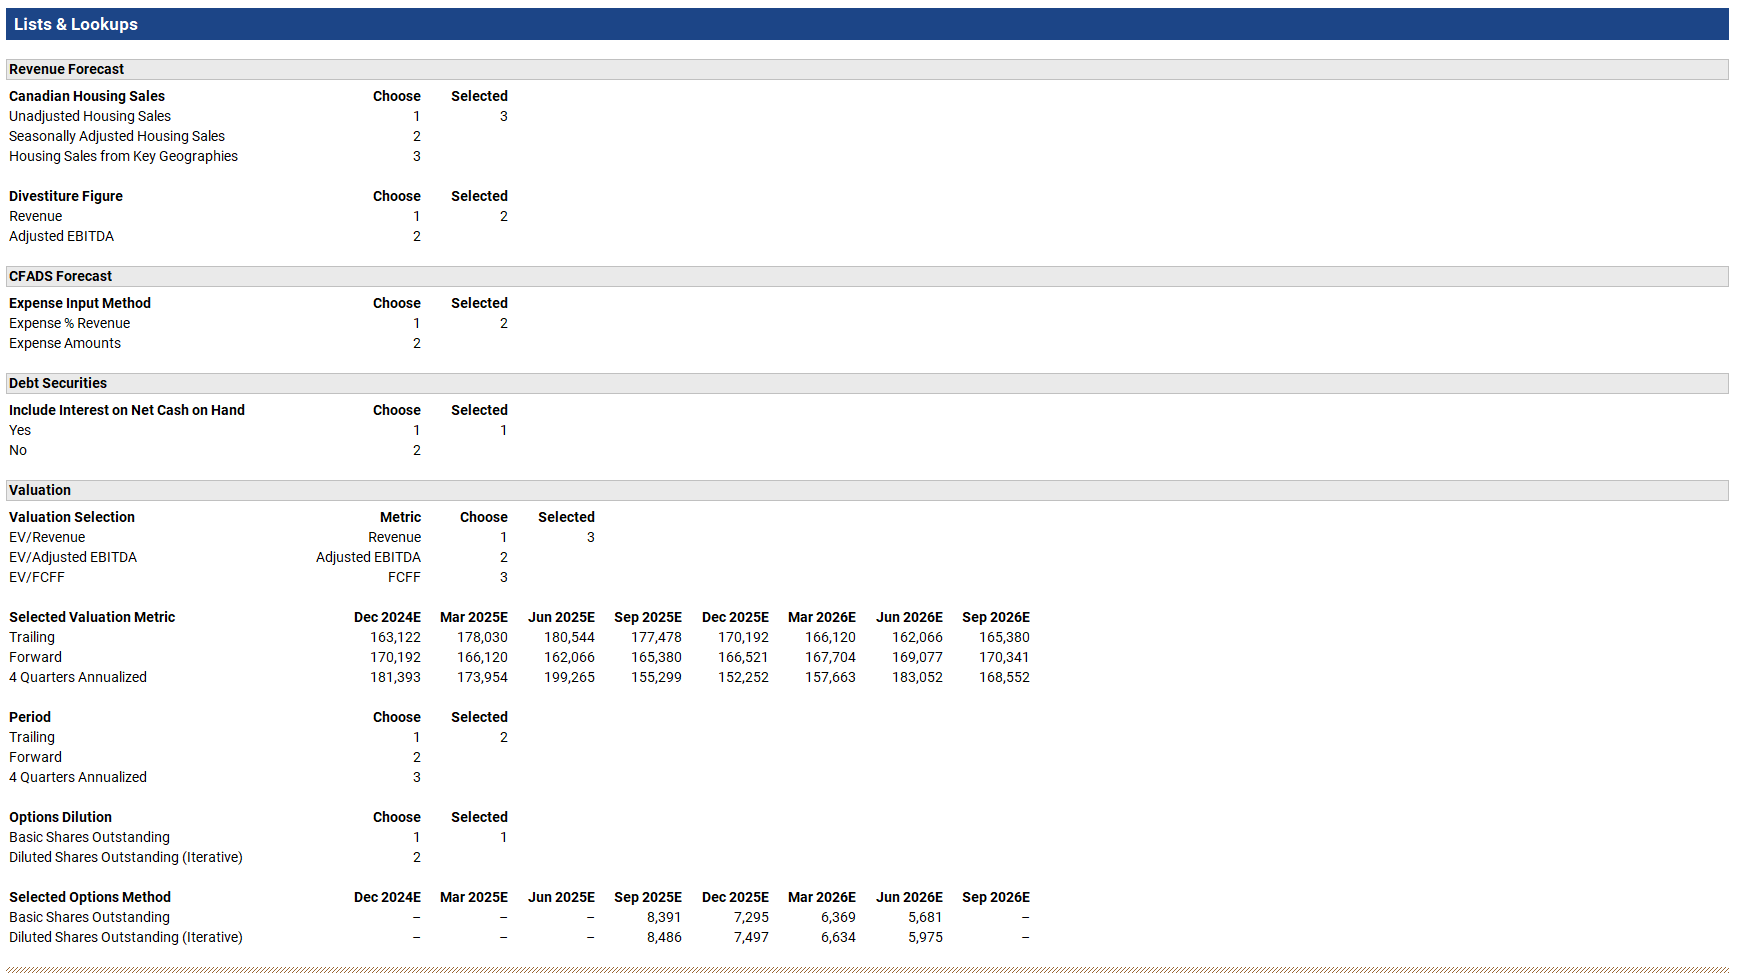
Lists & Lookups, which is the final section of the model, has four portions:
Revenue Forecast
CFADS Forecast
Debt Securities
Valuation
These simply reference to instances in which I’ve created a dropdown list and need to use an XLOOKUP formula.
Closing Thoughts
Once again, here is a link to the model: LINK
Since I don’t like seeing iterated calculations produce $0 (which happens when the calculated value is something like $0.00000000001), I’ve included a bunch of round formulas throughout the model to prevent this from happening:

This is unquestionably poor model hygiene. However, I believe I’ve done in such a manner that prevents $0 from appearing in place of −, while ensuring everything balances. To the extent that you do see $0, if you navigate to the cell and press F2 then Enter, it should disappear. This is assuming you have workbook calculations set to automatic and have enabled iterative calculations:
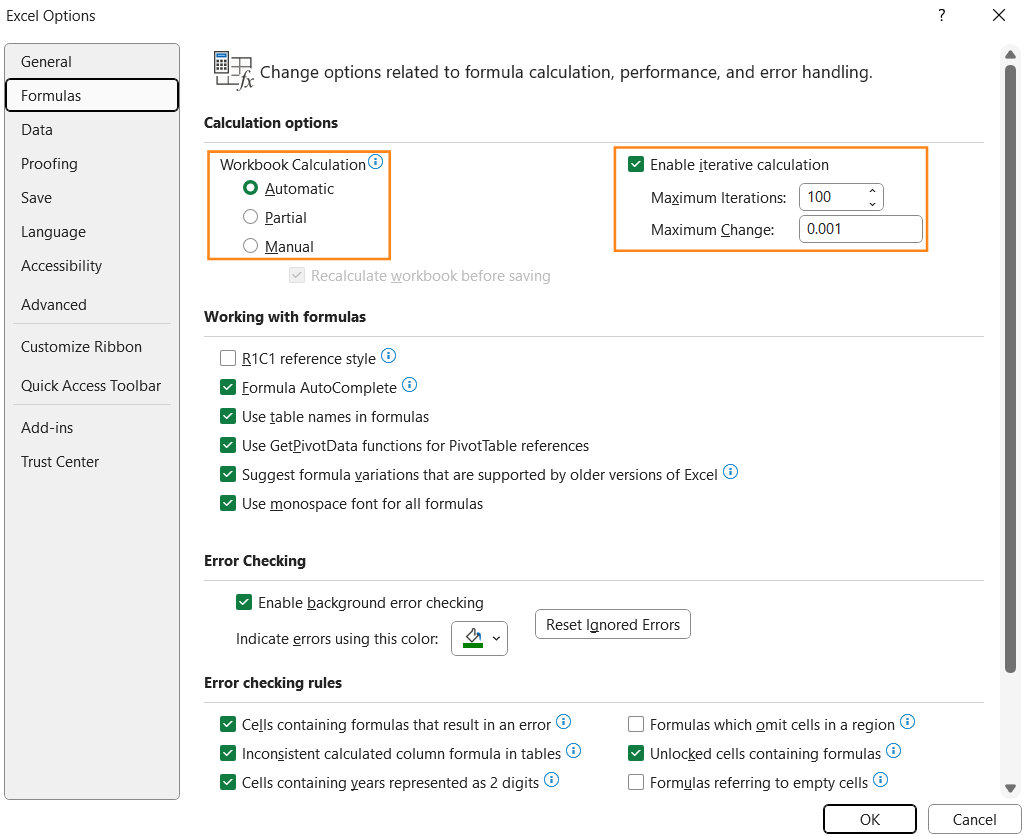
To state this one final time, I’m by no means claiming the numbers in my model are indicative of the results D&D’s going to report in the future. A lot will depend on Engine’s ability to pare debt and increase free cash flow conversion, with the latter depending primarily on lowering additions to intangibles and acquisition and restructuring costs.
I should mention, I no longer hold the stock — mainly for two reasons:
I took an unbelievable roll of the dice by borrowing as much as I did to buy D&D. Since that worked out swimmingly, given the insane amount of time I’ve spent reading essentially everything D&D put out, in addition to the hundreds of hours I’ve spent researching OneMove, I wouldn’t be able to handle losing money on D&D at this point. I already got fucked out of a lot by the unfortunate timing of sales around the competition investigation announcement and the PEXA take-private announcement. I’ll caveat this by saying if it gets cheap enough, I’d be interested.
I feel like the level of debt and D&D’s correlation to the real estate cycle necessitates a watchful eye and I don’t want to commit any more time than I already have.
I wish the best of luck to Matt on his next venture, Engine on the turn around, and D&D shareholders.
Legal Disclaimer
The information provided on this web page is for informational and discussion purposes only and does not constitute financial, investment, or other professional advice. Nothing contained herein should be construed as a recommendation or endorsement to buy or sell any securities or other financial instruments. The content is not intended to be relied upon for investment decisions, and you should consult with your own financial advisor or other professional before making any such decisions.
The questions, information, and topics raised are designed to foster thoughtful dialogue and engagement. I am not accusing any individual, organization, or entity of misconduct, wrongdoing, or illegal activity.
Nothing contained herein should be construed as an allegation or implication of impropriety. All opinions expressed are my own and are meant to encourage open and respectful discussion.
I make no representations or warranties as to the accuracy, completeness, or timeliness of the information provided and assume no liability or responsibility for any errors or omissions. The use of this web page and the information contained herein is at your own risk.
Please be advised that I currently do not own shares of Dye & Durham (ticker DND on the TSX) but may buy or sell shares and/or options in the future without prior disclosure.